Other Parts Discussed in Thread: TCAN4550, , TCAN4550EVM
Tool/software:
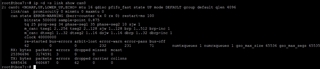
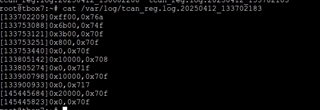
The problem reappears regularly, and I read all registers when the problem occurs:
cat /sys/kernel/debug/regmap/spi0.0/registers
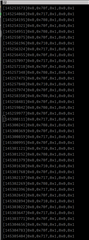
This is the kernel log of the Linux system:
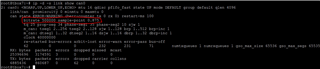
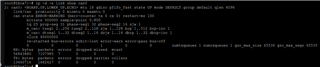
This is the result of running "ip -d -s link show can0":