This thread has been locked.

If you have a related question, please click the "Ask a related question" button in the top right corner. The newly created question will be automatically linked to this question.

DP83822I: Network lost after several hours stability test

Part Number: DP83822I

Hi team,
We have serval units that lost network after hours stability test. we use RMII mode

The findings so far:
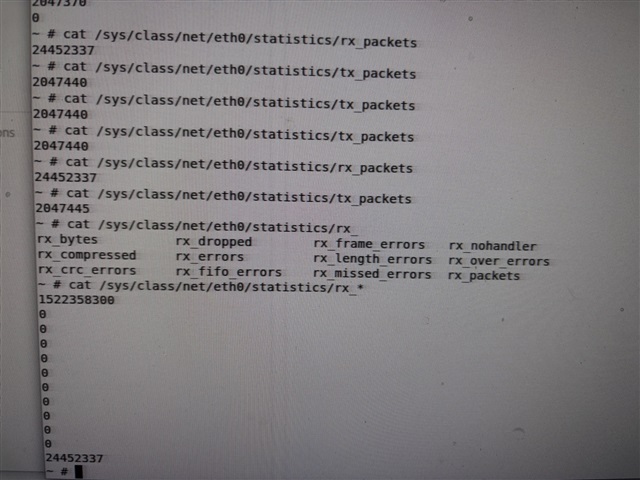
1. when issue occurred , the TX has packet increment but the RX keeps no change after ping operation

root@**:~# ip -s link show eth0
2: eth0: <BROADCAST,MULTICAST,UP,LOWER_UP> mtu 1500 qdisc fq state UP mode DEFAULT group default qlen 1000
    link/ether e8:27:25:13:32:4b brd ff:ff:ff:ff:ff:ff
    RX:  bytes packets errors dropped  missed   mcast           
       2007598   18219      0       0       0       0 
    TX:  bytes packets errors dropped carrier collsns           
      12060576   36165      0       0       0       0 

2. we tried the MII loopback according to datasheet and  https://docs.ampnuts.ru/ti.com.datasheet/DP83822I/Application_note_SNLA266.PDF

001F 8000 //software reset (clears register)

0000 6100 //programs DUT to 100BASE-TX mode and enables MII Loopback

001F 4000 //digital reset (doesn’t clear register)

Disable AUTO-MIDX(0x0019) : bit 15 set to 0

 ethtool --change eth0 speed 100 duplex full autoneg off

~ # ip a
1: lo: <LOOPBACK,UP,LOWER_UP> mtu 65536 qdisc noqueue state UNKNOWN group default qlen 1000
    link/loopback 00:00:00:00:00:00 brd 00:00:00:00:00:00
    inet 127.0.0.1/8 scope host lo
       valid_lft forever preferred_lft forever
    inet6 ::1/128 scope host 
       valid_lft forever preferred_lft forever
2: eth0: <NO-CARRIER,BROADCAST,MULTICAST,PROMISC,UP> mtu 1500 qdisc fq state DOWN group default qlen 1000
    link/ether e8:27:25:1b:79:98 brd ff:ff:ff:ff:ff:ff
~ # 

after above steps eth0 cannot up , but on normal unit it can up and have a address, and i also can see both RX/TX increments with ping operation

3.Another finding is ip link eth0 down && ip link eth0 up  can recover the network communication

This is the 0112.log  when network down including 0x0 to 0x1F, ethtool eth0 and ethtool -S eth0

Could you help check if i am missing any vital things on MII loop or anything wrong?

  • Hi,

    What is the test you have done for MII loopback?

    Because the interface says it has no carrier, could you try disabling all the PHY interrupt masks as a start to see if that removes the issue? There can be a chance that the Linux is overreacting from continuous IRQs from the PHY. 
    Also, if possible, could you provide dmesg of the PHY to see if there are anything going wrong when this issue occurs? Because the PHY is fine when the interface gets reseted on the Linux side (ip link set down/up dev eth0), I think there can be a chance something goes wrong on Linux.

    Best,

    J

  • For MII loopback,I applied the register configuration as above and ping subnet address and observe the packets by "ip -s link show eth0", Both RX and TX packets has increment on normal unit.

    True, the eth0 can up when i masked the interrupt(0x0012, 0x0013), but still couldn't help recover the communication(RX packets still keeps no change) on  unit of network lost.

    And has no findings from dmesg

    ambarella-dwmac-eqos ffe000e000.ethernet: EthernetMac_index = 0
    ambarella-dwmac-eqos ffe000e000.ethernet: EthernetMac_dma_cap = 40 bits
    ambarella-dwmac-eqos ffe000e000.ethernet: select RMII mode
    ambarella-dwmac-eqos ffe000e000.ethernet: User ID: 0x60, Synopsys ID: 0x53
    ambarella-dwmac-eqos ffe000e000.ethernet:     DWMAC4/5
    ambarella-dwmac-eqos ffe000e000.ethernet: DMA HW capability register supported
    ambarella-dwmac-eqos ffe000e000.ethernet: RX Checksum Offload Engine supported
    ambarella-dwmac-eqos ffe000e000.ethernet: TX Checksum insertion supported
    ambarella-dwmac-eqos ffe000e000.ethernet: Wake-Up On Lan supported
    ambarella-dwmac-eqos ffe000e000.ethernet: TSO supported
    ambarella-dwmac-eqos ffe000e000.ethernet: Enable RX Mitigation via HW Watchdog Timer
    ambarella-dwmac-eqos ffe000e000.ethernet: device MAC address 2a:34:b2:0a:cd:b1
    ambarella-dwmac-eqos ffe000e000.ethernet: Enabled RFS Flow TC (entries=8)
    ambarella-dwmac-eqos ffe000e000.ethernet: TSO feature enabled
    ambarella-dwmac-eqos ffe000e000.ethernet: Using 40 bits DMA width
    ambarella-dwmac-eqos ffe000e000.ethernet: stmmac_dvr_probe OK
    ambarella-dwmac-eqos ffe000e000.ethernet eth0: PHY [stmmac-0:01] driver [TI DP83822] (irq=POLL)
    ambarella-dwmac-eqos ffe000e000.ethernet eth0: Register MEM_TYPE_PAGE_POOL RxQ-0
    dwmac4: Master AXI performs fixed burst length
    ambarella-dwmac-eqos ffe000e000.ethernet eth0: No Safety Features support found
    ambarella-dwmac-eqos ffe000e000.ethernet eth0: No MAC Management Counters available                    
    ambarella-dwmac-eqos ffe000e000.ethernet eth0: IEEE 1588-2008 Advanced Timestamp supported
    ambarella-dwmac-eqos ffe000e000.ethernet eth0: configuring for phy/rmii link mode
    ambarella-dwmac-eqos ffe000e000.ethernet eth0: Link is Up - 100Mbps/Full - flow control rx/tx
    MACsec IEEE 802.1AE 
     ambarella-dwmac-eqos ffe000e000.ethernet eth0: Link is Down
     ambarella-dwmac-eqos ffe000e000.ethernet eth0: Link is Up - 100Mbps/Full - flow control rx/tx


    But interrupt also keeps no change
    ~ # cat /proc/interrupts | grep eth0
     30:      23593          0     GIC-0 101 Level     eth0
     31:          0          0     GIC-0 100 Level     eth0
     32:          0          0     GIC-0  96 Level     eth0
    

    I thought this problem was caused by some unexpected behavior but have no idea what possible reason it is.
    Logs of operation

    ~ # ip a
    1: lo: <LOOPBACK,UP,LOWER_UP> mtu 65536 qdisc noqueue state UNKNOWN group default qlen 1000
        link/loopback 00:00:00:00:00:00 brd 00:00:00:00:00:00
        inet 127.0.0.1/8 scope host lo
           valid_lft forever preferred_lft forever
        inet6 ::1/128 scope host 
           valid_lft forever preferred_lft forever
    2: eth0: <BROADCAST,MULTICAST,UP,LOWER_UP> mtu 1500 qdisc fq state UP group default qlen 1000
        link/ether e8:27:25:13:4e:f9 brd ff:ff:ff:ff:ff:ff
        inet 169.254.167.167/16 scope link eth0
           valid_lft forever preferred_lft forever
        inet6 fe80::ea27:25ff:fe13:4ef9/64 scope link 
           valid_lft forever preferred_lft forever
    ~ # 
    ~ # pwd
    /root
    ~ # 
    ~ # 
    ~ # ./phyrw.sh r 0x0012
    0000
    ~ # ./phyrw.sh r 0x0013
    0000
    ~ # 
    ~ # 
    ~ # ./phyrw.sh w 0x0012 0x00ff
    ~ # ./phyrw.sh r 0x0012
    0x00ff
    ~ # ./phyrw.sh w 0x0013 0x00ff
    ~ # ./phyrw.sh r 0x0013
    0x00ff
    ~ # 
    ~ # 
    ~ # ip -s link show eth0
    2: eth0: <BROADCAST,MULTICAST,UP,LOWER_UP> mtu 1500 qdisc fq state UP mode DEFAULT group default qlen 1000
        link/ether e8:27:25:13:4e:f9 brd ff:ff:ff:ff:ff:ff
        RX:   bytes  packets errors dropped  missed   mcast           
          824296168  5839532      0       0       0       0 
        TX:   bytes  packets errors dropped carrier collsns           
        22069194316 18935380      0       0       0       0 
    ~ # 
    ~ #
    ~ # ./phyrw.sh w 0x001f 0x8000
    ~ #
    ~ # ./phyrw.sh w 0x0000 0x6100
    ~ # ./phyrw.sh w 0x001f 0x4000
    ~ # ./phyrw.sh r 0x0019
    0x8421
    ~ # ./phyrw.sh w 0x0019 0x0421
    ~ # ./phyrw.sh r 0x0019
    0x0421
    ~ #
    ~ # ip a
    1: lo: <LOOPBACK,UP,LOWER_UP> mtu 65536 qdisc noqueue state UNKNOWN group default qlen 1000
        link/loopback 00:00:00:00:00:00 brd 00:00:00:00:00:00
        inet 127.0.0.1/8 scope host lo
           valid_lft forever preferred_lft forever
        inet6 ::1/128 scope host
           valid_lft forever preferred_lft forever
    2: eth0: <NO-CARRIER,BROADCAST,MULTICAST,UP> mtu 1500 qdisc fq state DOWN group default qlen 1000
        link/ether e8:27:25:13:4e:f9 brd ff:ff:ff:ff:ff:ff
    ~ #
    ~ # ethtool --change eth0 speed 100 duplex full autoneg off
    ~ #
    ~ # ip a
    1: lo: <LOOPBACK,UP,LOWER_UP> mtu 65536 qdisc noqueue state UNKNOWN group default qlen 1000
        link/loopback 00:00:00:00:00:00 brd 00:00:00:00:00:00
        inet 127.0.0.1/8 scope host lo
           valid_lft forever preferred_lft forever
        inet6 ::1/128 scope host
           valid_lft forever preferred_lft forever
    2: eth0: <BROADCAST,MULTICAST,UP,LOWER_UP> mtu 1500 qdisc fq state UP group default qlen 1000
        link/ether e8:27:25:13:4e:f9 brd ff:ff:ff:ff:ff:ff
        inet6 fe80::ea27:25ff:fe13:4ef9/64 scope link
           valid_lft forever preferred_lft forever
    ~ #
    ~ # ip a
    1: lo: <LOOPBACK,UP,LOWER_UP> mtu 65536 qdisc noqueue state UNKNOWN group default qlen 1000
        link/loopback 00:00:00:00:00:00 brd 00:00:00:00:00:00
        inet 127.0.0.1/8 scope host lo
           valid_lft forever preferred_lft forever
        inet6 ::1/128 scope host
           valid_lft forever preferred_lft forever
    2: eth0: <BROADCAST,MULTICAST,UP,LOWER_UP> mtu 1500 qdisc fq state UP group default qlen 1000
        link/ether e8:27:25:13:4e:f9 brd ff:ff:ff:ff:ff:ff
        inet 169.254.167.167/16 scope link eth0
           valid_lft forever preferred_lft forever
        inet6 fe80::ea27:25ff:fe13:4ef9/64 scope link
           valid_lft forever preferred_lft forever
    ~ #
    ~ # ip -s link show eth0
    2: eth0: <BROADCAST,MULTICAST,UP,LOWER_UP> mtu 1500 qdisc fq state UP mode DEFAULT group default qlen 1000
        link/ether e8:27:25:13:4e:f9 brd ff:ff:ff:ff:ff:ff
        RX:   bytes  packets errors dropped  missed   mcast           
          824296168  5839532      0       0       0       0 
        TX:   bytes  packets errors dropped carrier collsns           
        22069357779 18935815      0       0       0       0 
    ~ # 
    ~ # ping 169.254.1.2
    No response from 169.254.1.2
    ~ # ip -s link show eth0
    2: eth0: <BROADCAST,MULTICAST,UP,LOWER_UP> mtu 1500 qdisc fq state UP mode DEFAULT group default qlen 1000
        link/ether e8:27:25:13:4e:f9 brd ff:ff:ff:ff:ff:ff
        RX:   bytes  packets errors dropped  missed   mcast           
          824296168  5839532      0       0       0       0 
        TX:   bytes  packets errors dropped carrier collsns           
        22069361271 18935829      0       0       0       0
    ~ # 
    ~ # ethtool --change eth0 speed 100 duplex full autoneg on
    ~ # 
    ~ # ip -s link show eth0
    2: eth0: <BROADCAST,MULTICAST,UP,LOWER_UP> mtu 1500 qdisc fq state UP mode DEFAULT group default qlen 1000
        link/ether e8:27:25:13:4e:f9 brd ff:ff:ff:ff:ff:ff
        RX:   bytes  packets errors dropped  missed   mcast           
          824296168  5839532      0       0       0       0 
        TX:   bytes  packets errors dropped carrier collsns           
        22069458924 18936100      0       0       0       0 
    ~ # 
    ~ # ethtool eth0
    Settings for eth0:
            Supported ports: [ TP    MII ]
            Supported link modes:   10baseT/Half 10baseT/Full
                                    100baseT/Half 100baseT/Full
            Supported pause frame use: Symmetric Receive-only
            Supports auto-negotiation: Yes
            Supported FEC modes: Not reported
            Advertised link modes:  100baseT/Full
            Advertised pause frame use: Symmetric Receive-only
            Advertised auto-negotiation: Yes
            Advertised FEC modes: Not reported
            Link partner advertised link modes:  10baseT/Half 10baseT/Full
                                                 100baseT/Half 100baseT/Full
            Link partner advertised pause frame use: Symmetric Receive-only
            Link partner advertised auto-negotiation: Yes
            Link partner advertised FEC modes: Not reported
            Speed: 100Mb/s
            Duplex: Full
            Auto-negotiation: on
            Port: Twisted Pair
            PHYAD: 1
            Transceiver: external
            MDI-X: Unknown
            Supports Wake-on: ug
            Wake-on: d
            Current message level: 0x0000003f (63)
                                   drv probe link timer ifdown ifup
            Link detected: yes
    ~ #

  • Hi, 

    Interesting. 

    Is this case, could you do a few things for me?
    When you do MII loopback, could you check ethtool -S eth0 stats? We want to make sure that the RX packets incrementing are not due to internal kernel loopback. 

    Also, could you put the PHY in reverse loopback mode once this happens and see if you can loop back the packets from the LP to the PHY and back to the LP? This will ensure that the MDI side is also working fine. 

    Best,
    J


  • Hi J
    Yes, will check ethtool -S eth0 when reproduced, we reboot the unit and started test again.

    see if you can loop back the packets from the LP to the PHY and back to the LP

    How can i see if it is work, by same ways above? Also need to mask interrupt?

    Thank you!

  • Hi Chris, 

    We typically recommend wireshark to capture the packets and pktgen to generate packets. You can put the PHY in reverse loopback mode (0x16 = 0x10). And use pktgen from the LP (if the LP is Linux) to send packets. Because of reverse loopback, the packet should be sent back to the LP and you can capture that using wireshark to see if that packet was intended for the DUT. You should not need to mask interrupt. 

    Best,
    J

  • NIC statistics:
         tx_underflow: 0
         tx_carrier: 0
         tx_losscarrier: 0
         vlan_tag: 0
         tx_deferred: 0
         tx_vlan: 0
         tx_jabber: 0
         tx_frame_flushed: 0
         tx_payload_error: 0
         tx_ip_header_error: 0
         rx_desc: 0
         sa_filter_fail: 0
         overflow_error: 0
         ipc_csum_error: 0
         rx_collision: 0
         rx_crc_errors: 0
         dribbling_bit: 0
         rx_length: 0
         rx_mii: 0
         rx_multicast: 0
         rx_gmac_overflow: 0
         rx_watchdog: 0
         da_rx_filter_fail: 0
         sa_rx_filter_fail: 0
         rx_missed_cntr: 0
         rx_overflow_cntr: 0
         rx_vlan: 0
         rx_split_hdr_pkt_n: 0
         tx_undeflow_irq: 0
         tx_process_stopped_irq: 0
         tx_jabber_irq: 0
         rx_overflow_irq: 0
         rx_buf_unav_irq: 0
         rx_process_stopped_irq: 0
         rx_watchdog_irq: 0
         tx_early_irq: 0
         fatal_bus_error_irq: 0
         rx_early_irq: 43079
         threshold: 1
         tx_pkt_n: 4238228
         rx_pkt_n: 6242847
         normal_irq_n: 6477500
         rx_normal_irq_n: 6087160
         napi_poll: 15166814
         tx_normal_irq_n: 401374
         tx_clean: 9079956
         tx_set_ic_bit: 394301
         irq_receive_pmt_irq_n: 0
         mmc_tx_irq_n: 0
         mmc_rx_irq_n: 0
         mmc_rx_csum_offload_irq_n: 0
         irq_tx_path_in_lpi_mode_n: 0
         irq_tx_path_exit_lpi_mode_n: 0
         irq_rx_path_in_lpi_mode_n: 0
         irq_rx_path_exit_lpi_mode_n: 0
         phy_eee_wakeup_error_n: 0
         ip_hdr_err: 0
         ip_payload_err: 0
         ip_csum_bypassed: 93070
         ipv4_pkt_rcvd: 6096107
         ipv6_pkt_rcvd: 49310
         no_ptp_rx_msg_type_ext: 6242847
         ptp_rx_msg_type_sync: 0
         ptp_rx_msg_type_follow_up: 0
         ptp_rx_msg_type_delay_req: 0
         ptp_rx_msg_type_delay_resp: 0
         ptp_rx_msg_type_pdelay_req: 0
         ptp_rx_msg_type_pdelay_resp: 0
         ptp_rx_msg_type_pdelay_follow_up: 0
         ptp_rx_msg_type_announce: 0
         ptp_rx_msg_type_management: 0
         ptp_rx_msg_pkt_reserved_type: 0
         ptp_frame_type: 0
         ptp_ver: 0
         timestamp_dropped: 0
         av_pkt_rcvd: 0
         av_tagged_pkt_rcvd: 0
         vlan_tag_priority_val: 0
         l3_filter_match: 0
         l4_filter_match: 0
         l3_l4_filter_no_match: 0
         irq_pcs_ane_n: 0
         irq_pcs_link_n: 0
         irq_rgmii_n: 0
         mtl_tx_status_fifo_full: 0
         mtl_tx_fifo_not_empty: 795
         mmtl_fifo_ctrl: 8
         mtl_tx_fifo_read_ctrl_write: 0
         mtl_tx_fifo_read_ctrl_wait: 0
         mtl_tx_fifo_read_ctrl_read: 221
         mtl_tx_fifo_read_ctrl_idle: 0
         mac_tx_in_pause: 622
         mac_tx_frame_ctrl_xfer: 214
         mac_tx_frame_ctrl_idle: 0
         mac_tx_frame_ctrl_wait: 5
         mac_tx_frame_ctrl_pause: 0
         mac_gmii_tx_proto_engine: 219
         mtl_rx_fifo_fill_level_full: 0
         mtl_rx_fifo_fill_above_thresh: 0
         mtl_rx_fifo_fill_below_thresh: 0
         mtl_rx_fifo_fill_level_empty: 0
         mtl_rx_fifo_read_ctrl_flush: 0
         mtl_rx_fifo_read_ctrl_read_data: 0
         mtl_rx_fifo_read_ctrl_status: 0
         mtl_rx_fifo_read_ctrl_idle: 0
         mtl_rx_fifo_ctrl_active: 10
         mac_rx_frame_ctrl_fifo: 1
         mac_gmii_rx_proto_engine: 999
         tx_tso_frames: 1718587
         tx_tso_nfrags: 5145736
         mtl_est_cgce: 0
         mtl_est_hlbs: 0
         mtl_est_hlbf: 0
         mtl_est_btre: 0
         mtl_est_btrlm: 0
         q0_tx_pkt_n: 4238228
         q0_tx_irq_n: 401374
         q0_rx_pkt_n: 6242847
         q0_rx_irq_n: 6087160
    
    NIC statistics:
         tx_underflow: 0
         tx_carrier: 0
         tx_losscarrier: 0
         vlan_tag: 0
         tx_deferred: 0
         tx_vlan: 0
         tx_jabber: 0
         tx_frame_flushed: 0
         tx_payload_error: 0
         tx_ip_header_error: 0
         rx_desc: 0
         sa_filter_fail: 0
         overflow_error: 0
         ipc_csum_error: 0
         rx_collision: 0
         rx_crc_errors: 0
         dribbling_bit: 0
         rx_length: 0
         rx_mii: 0
         rx_multicast: 0
         rx_gmac_overflow: 0
         rx_watchdog: 0
         da_rx_filter_fail: 0
         sa_rx_filter_fail: 0
         rx_missed_cntr: 0
         rx_overflow_cntr: 0
         rx_vlan: 0
         rx_split_hdr_pkt_n: 0
         tx_undeflow_irq: 0
         tx_process_stopped_irq: 0
         tx_jabber_irq: 0
         rx_overflow_irq: 0
         rx_buf_unav_irq: 0
         rx_process_stopped_irq: 0
         rx_watchdog_irq: 0
         tx_early_irq: 0
         fatal_bus_error_irq: 0
         rx_early_irq: 43079
         threshold: 1
         tx_pkt_n: 4237494
         rx_pkt_n: 6242847
         normal_irq_n: 6477471
         rx_normal_irq_n: 6087160
         napi_poll: 15166205
         tx_normal_irq_n: 401345
         tx_clean: 9079347
         tx_set_ic_bit: 394272
         irq_receive_pmt_irq_n: 0
         mmc_tx_irq_n: 0
         mmc_rx_irq_n: 0
         mmc_rx_csum_offload_irq_n: 0
         irq_tx_path_in_lpi_mode_n: 0
         irq_tx_path_exit_lpi_mode_n: 0
         irq_rx_path_in_lpi_mode_n: 0
         irq_rx_path_exit_lpi_mode_n: 0
         phy_eee_wakeup_error_n: 0
         ip_hdr_err: 0
         ip_payload_err: 0
         ip_csum_bypassed: 93070
         ipv4_pkt_rcvd: 6096107
         ipv6_pkt_rcvd: 49310
         no_ptp_rx_msg_type_ext: 6242847
         ptp_rx_msg_type_sync: 0
         ptp_rx_msg_type_follow_up: 0
         ptp_rx_msg_type_delay_req: 0
         ptp_rx_msg_type_delay_resp: 0
         ptp_rx_msg_type_pdelay_req: 0
         ptp_rx_msg_type_pdelay_resp: 0
         ptp_rx_msg_type_pdelay_follow_up: 0
         ptp_rx_msg_type_announce: 0
         ptp_rx_msg_type_management: 0
         ptp_rx_msg_pkt_reserved_type: 0
         ptp_frame_type: 0
         ptp_ver: 0
         timestamp_dropped: 0
         av_pkt_rcvd: 0
         av_tagged_pkt_rcvd: 0
         vlan_tag_priority_val: 0
         l3_filter_match: 0
         l4_filter_match: 0
         l3_l4_filter_no_match: 0
         irq_pcs_ane_n: 0
         irq_pcs_link_n: 0
         irq_rgmii_n: 0
         mtl_tx_status_fifo_full: 0
         mtl_tx_fifo_not_empty: 795
         mmtl_fifo_ctrl: 8
         mtl_tx_fifo_read_ctrl_write: 0
         mtl_tx_fifo_read_ctrl_wait: 0
         mtl_tx_fifo_read_ctrl_read: 221
         mtl_tx_fifo_read_ctrl_idle: 0
         mac_tx_in_pause: 622
         mac_tx_frame_ctrl_xfer: 214
         mac_tx_frame_ctrl_idle: 0
         mac_tx_frame_ctrl_wait: 5
         mac_tx_frame_ctrl_pause: 0
         mac_gmii_tx_proto_engine: 219
         mtl_rx_fifo_fill_level_full: 0
         mtl_rx_fifo_fill_above_thresh: 0
         mtl_rx_fifo_fill_below_thresh: 0
         mtl_rx_fifo_fill_level_empty: 0
         mtl_rx_fifo_read_ctrl_flush: 0
         mtl_rx_fifo_read_ctrl_read_data: 0
         mtl_rx_fifo_read_ctrl_status: 0
         mtl_rx_fifo_read_ctrl_idle: 0
         mtl_rx_fifo_ctrl_active: 10
         mac_rx_frame_ctrl_fifo: 1
         mac_gmii_rx_proto_engine: 998
         tx_tso_frames: 1718587
         tx_tso_nfrags: 5145736
         mtl_est_cgce: 0
         mtl_est_hlbs: 0
         mtl_est_hlbf: 0
         mtl_est_btre: 0
         mtl_est_btrlm: 0
         q0_tx_pkt_n: 4237494
         q0_tx_irq_n: 401345
         q0_rx_pkt_n: 6242847
         q0_rx_irq_n: 6087160


    I did a mii loopback and captured the ethtool -S eth0.
    I'm try to install the pktgen now

  • Hi Chris, 

    Do you also see any errors on register 15h of the PHY? That tracks the incoming symbol errors. 

    I see that no packets are being received even though they are transmitted for both regular packet counts and q0 packet counts. 
    What are the packet sizes that is being transmitted? 
    What is the ppm of the XI clock being fetched into the PHY?
    Can you also check register 17h of the PHY when this happens? I wonder if there are issues with RMII FIFO. 

    Best,
    J

  • Hi J
    I read the status when issue was reproduced and looks like no errors, if MDI side has something wrong, is any register we should care?

    ~ # 
    ~ # ./phyrw.sh r 0x0015
    0000
    ~ # ./phyrw.sh r 0x0017
    0x0065
    ~ # 
     

    The packet size should be default value(56bytes)
    ping -c 3 169.254.190.191
    PING 169.254.190.191 (169.254.190.191) 56(84) bytes of data.

    The ppm does not exceed 20 on normal units but we will double check when issue occurred

    I have managed to use the AF_PACKET PMD instead pktgen as my virtual PCIE device is not supported by DPDK.

    normal unit test with recerse setting

    testpmd> set fwd mac
    Set mac packet forwarding mode
    testpmd> start
    mac packet forwarding - ports=1 - cores=1 - streams=1 - NUMA support enabled, MP allocation mode: native
    Logical Core 3 (socket 0) forwards packets on 1 streams:
      RX P=0/Q=0 (socket 0) -> TX P=0/Q=0 (socket 0) peer=02:00:00:00:00:00
    
      mac packet forwarding packets/burst=32
      nb forwarding cores=1 - nb forwarding ports=1
      port 0: RX queue number: 1 Tx queue number: 1
        Rx offloads=0x0 Tx offloads=0x0
        RX queue: 0
          RX desc=256 - RX free threshold=0
          RX threshold registers: pthresh=0 hthresh=0  wthresh=0
          RX Offloads=0x0
        TX queue: 0
          TX desc=256 - TX free threshold=0
          TX threshold registers: pthresh=0 hthresh=0  wthresh=0
          TX offloads=0x0 - TX RS bit threshold=0
    testpmd> show port stats 0
    
      ######################## NIC statistics for port 0  ########################
      RX-packets: 92         RX-missed: 0          RX-bytes:  27133
      RX-errors: 0
      RX-nombuf:  0         
      TX-packets: 1          TX-errors: 0          TX-bytes:  253
    
      Throughput (since last show)
      Rx-pps:            0          Rx-bps:            0
      Tx-pps:            0          Tx-bps:            0
      ############################################################################
    testpmd> stop
    Telling cores to stop...
    Waiting for lcores to finish...
    
      ---------------------- Forward statistics for port 0  ----------------------
      RX-packets: 2              RX-dropped: 0             RX-total: 2
      TX-packets: 2              TX-dropped: 0             TX-total: 2
      ----------------------------------------------------------------------------
    
      +++++++++++++++ Accumulated forward statistics for all ports+++++++++++++++
      RX-packets: 2              RX-dropped: 0             RX-total: 2
      TX-packets: 2              TX-dropped: 0             TX-total: 2
      ++++++++++++++++++++++++++++++++++++++++++++++++++++++++++++++++++++++++++++
    
    Done.
    testpmd> show port stats 0
    
      ######################## NIC statistics for port 0  ########################
      RX-packets: 93         RX-missed: 0          RX-bytes:  27386
      RX-errors: 0
      RX-nombuf:  0         
      TX-packets: 2          TX-errors: 0          TX-bytes:  506
    
      Throughput (since last show)
      Rx-pps:            0          Rx-bps:           64
      Tx-pps:            0          Tx-bps:           64
      ############################################################################
    testpmd> 


    test when disconnect the device with host
    testpmd> clear port stats 0
    
      NIC statistics for port 0 cleared
    testpmd> set fwd mac
    Set mac packet forwarding mode
    testpmd> show port stats 0
    
      ######################## NIC statistics for port 0  ########################
      RX-packets: 0          RX-missed: 0          RX-bytes:  0
      RX-errors: 0
      RX-nombuf:  0         
      TX-packets: 0          TX-errors: 0          TX-bytes:  0
    
      Throughput (since last show)
      Rx-pps:            0          Rx-bps:            0
      Tx-pps:            0          Tx-bps:            0
      ############################################################################
    testpmd> start
    mac packet forwarding - ports=1 - cores=1 - streams=1 - NUMA support enabled, MP allocation mode: native
    Logical Core 3 (socket 0) forwards packets on 1 streams:
      RX P=0/Q=0 (socket 0) -> TX P=0/Q=0 (socket 0) peer=02:00:00:00:00:00
    
      mac packet forwarding packets/burst=32
      nb forwarding cores=1 - nb forwarding ports=1
      port 0: RX queue number: 1 Tx queue number: 1
        Rx offloads=0x0 Tx offloads=0x0
        RX queue: 0
          RX desc=256 - RX free threshold=0
          RX threshold registers: pthresh=0 hthresh=0  wthresh=0
          RX Offloads=0x0
        TX queue: 0
          TX desc=256 - TX free threshold=0
          TX threshold registers: pthresh=0 hthresh=0  wthresh=0
          TX offloads=0x0 - TX RS bit threshold=0
    testpmd> show port stats 0
    
      ######################## NIC statistics for port 0  ########################
      RX-packets: 21         RX-missed: 0          RX-bytes:  4403
      RX-errors: 0
      RX-nombuf:  0         
      TX-packets: 0          TX-errors: 0          TX-bytes:  0
    
      Throughput (since last show)
      Rx-pps:            2          Rx-bps:         3904
      Tx-pps:            0          Tx-bps:            0
      ############################################################################
    testpmd> stop
    Telling cores to stop...
    Waiting for lcores to finish...
    
      ---------------------- Forward statistics for port 0  ----------------------
      RX-packets: 1              RX-dropped: 0             RX-total: 1
      TX-packets: 1              TX-dropped: 0             TX-total: 1
      ----------------------------------------------------------------------------
    
      +++++++++++++++ Accumulated forward statistics for all ports+++++++++++++++
      RX-packets: 1              RX-dropped: 0             RX-total: 1
      TX-packets: 1              TX-dropped: 0             TX-total: 1
      ++++++++++++++++++++++++++++++++++++++++++++++++++++++++++++++++++++++++++++
    
    Done.
    testpmd> show port stats 0
    
      ######################## NIC statistics for port 0  ########################
      RX-packets: 22         RX-missed: 0          RX-bytes:  4656
      RX-errors: 0
      RX-nombuf:  0         
      TX-packets: 1          TX-errors: 0          TX-bytes:  253
    
      Throughput (since last show)
      Rx-pps:            0          Rx-bps:           80
      Tx-pps:            0          Tx-bps:           80
      ############################################################################


    I will test the same way when reproduced again, if the method no problem

    Thank you for all the suggestions!

  • Hi Chris, 

    If there is an issue on MDI side, register 15h can capture symbol errors for incoming packets. Otherwise, the link status is the most obvious indicator to see if there are any issues on the MDI side. 

    It looks like the reverse loopback works in the normal mode. Please let me know how it works when the issue occurs. 

    Best,
    J

  • Hi J,
    This problem was reproduced again in a clean environment that a single device connected to host.
    I did mac forwarding test with testpmd before and after setting up reverse mode, it showed same behavior on statistics.

    Before

    testpmd> show port stats 0
    
      ######################## NIC statistics for port 0  ########################
      RX-packets: 0          RX-missed: 3          RX-bytes:  0
      RX-errors: 0
      RX-nombuf:  0         
      TX-packets: 0          TX-errors: 0          TX-bytes:  0
    
      Throughput (since last show)
      Rx-pps:            0          Rx-bps:            0
      Tx-pps:            0          Tx-bps:            0
      ############################################################################
    testpmd> 
    testpmd> set fwd mac
    Set mac packet forwarding mode
    testpmd> start
    mac packet forwarding - ports=1 - cores=1 - streams=1 - NUMA support enabled, MP allocation mode: native
    Logical Core 3 (socket 0) forwards packets on 1 streams:
      RX P=0/Q=0 (socket 0) -> TX P=0/Q=0 (socket 0) peer=02:00:00:00:00:00
    
      mac packet forwarding packets/burst=32
      nb forwarding cores=1 - nb forwarding ports=1
      port 0: RX queue number: 1 Tx queue number: 1
        Rx offloads=0x0 Tx offloads=0x0
        RX queue: 0
          RX desc=256 - RX free threshold=0
          RX threshold registers: pthresh=0 hthresh=0  wthresh=0
          RX Offloads=0x0
        TX queue: 0
          TX desc=256 - TX free threshold=0
          TX threshold registers: pthresh=0 hthresh=0  wthresh=0
          TX offloads=0x0 - TX RS bit threshold=0
    testpmd> show port stats 0
    
      ######################## NIC statistics for port 0  ########################
      RX-packets: 563        RX-missed: 53         RX-bytes:  414758
      RX-errors: 0
      RX-nombuf:  0         
      TX-packets: 51         TX-errors: 0          TX-bytes:  4552
    
      Throughput (since last show)
      Rx-pps:           15          Rx-bps:        90160
      Tx-pps:            1          Tx-bps:          984
      ############################################################################
    testpmd> stop
    Telling cores to stop...
    Waiting for lcores to finish...
    
      ---------------------- Forward statistics for port 0  ----------------------
      RX-packets: 73             RX-dropped: 0             RX-total: 73
      TX-packets: 73             TX-dropped: 0             TX-total: 73
      ----------------------------------------------------------------------------
    
      +++++++++++++++ Accumulated forward statistics for all ports+++++++++++++++
      RX-packets: 73             RX-dropped: 0             RX-total: 73
      TX-packets: 73             TX-dropped: 0             TX-total: 73
      ++++++++++++++++++++++++++++++++++++++++++++++++++++++++++++++++++++++++++++
    
    Done.
    testpmd> show port stats 0
    
      ######################## NIC statistics for port 0  ########################
      RX-packets: 585        RX-missed: 53         RX-bytes:  416348
      RX-errors: 0
      RX-nombuf:  0         
      TX-packets: 73         TX-errors: 0          TX-bytes:  6142
    
      Throughput (since last show)
      Rx-pps:            0          Rx-bps:          168
      Tx-pps:            0          Tx-bps:          168
      ############################################################################
    testpmd> 


    After
    testpmd> clear port stats 0
    
      NIC statistics for port 0 cleared
    testpmd> 
    testpmd> show port stats 0
    
      ######################## NIC statistics for port 0  ########################
      RX-packets: 0          RX-missed: 9          RX-bytes:  0
      RX-errors: 0
      RX-nombuf:  0         
      TX-packets: 0          TX-errors: 0          TX-bytes:  0
    
      Throughput (since last show)
      Rx-pps:            0          Rx-bps:            0
      Tx-pps:            0          Tx-bps:            0
      ############################################################################
    testpmd> set fwd mac
    Set mac packet forwarding mode
    testpmd> start
    mac packet forwarding - ports=1 - cores=1 - streams=1 - NUMA support enabled, MP allocation mode: native
    Logical Core 3 (socket 0) forwards packets on 1 streams:
      RX P=0/Q=0 (socket 0) -> TX P=0/Q=0 (socket 0) peer=02:00:00:00:00:00
    
      mac packet forwarding packets/burst=32
      nb forwarding cores=1 - nb forwarding ports=1
      port 0: RX queue number: 1 Tx queue number: 1
        Rx offloads=0x0 Tx offloads=0x0
        RX queue: 0
          RX desc=256 - RX free threshold=0
          RX threshold registers: pthresh=0 hthresh=0  wthresh=0
          RX Offloads=0x0
        TX queue: 0
          TX desc=256 - TX free threshold=0
          TX threshold registers: pthresh=0 hthresh=0  wthresh=0
          TX offloads=0x0 - TX RS bit threshold=0
    testpmd> show port stats 0
    
      ######################## NIC statistics for port 0  ########################
      RX-packets: 550        RX-missed: 21         RX-bytes:  46726
      RX-errors: 0
      RX-nombuf:  0         
      TX-packets: 38         TX-errors: 0          TX-bytes:  2705
    
      Throughput (since last show)
      Rx-pps:           17          Rx-bps:        11632
      Tx-pps:            1          Tx-bps:          672
      ############################################################################
    testpmd> stop
    Telling cores to stop...
    Waiting for lcores to finish...
    
      ---------------------- Forward statistics for port 0  ----------------------
      RX-packets: 47             RX-dropped: 0             RX-total: 47
      TX-packets: 47             TX-dropped: 0             TX-total: 47
      ----------------------------------------------------------------------------
    
      +++++++++++++++ Accumulated forward statistics for all ports+++++++++++++++
      RX-packets: 47             RX-dropped: 0             RX-total: 47
      TX-packets: 47             TX-dropped: 0             TX-total: 47
      ++++++++++++++++++++++++++++++++++++++++++++++++++++++++++++++++++++++++++++
    
    Done.
    testpmd> 
    testpmd> show port stats 0
    
      ######################## NIC statistics for port 0  ########################
      RX-packets: 559        RX-missed: 1015       RX-bytes:  47104
      RX-errors: 0
      RX-nombuf:  0         
      TX-packets: 47         TX-errors: 0          TX-bytes:  3083
    
      Throughput (since last show)
      Rx-pps:            0          Rx-bps:            0
      Tx-pps:            0          Tx-bps:            0
      ############################################################################
    testpmd> 


    If we didn't miss any thing for MDI side. Is there any test that we should look for RMI side or self test to identify closer path?  Thank you

  • Hi Chris, 

    It looks like there are some RX packets being lost in both cases. 
    I wonder if packets consistently becoming lost is causing the connection to freeze almost. 
    Would restarting autonegotiation via register configuration solve this issue? I wonder if the connection just needs a refresh. You can set bit 9 of register 0h high. 

    Also, you can do a MII loopback and send packets from the MAC side of the problematic board and see if there are any RX packet errors being received. 
    You can set the PHY into MII loopback by setting bit 14 of register 0h high. 

    Please let me know your thoughts. 

    Best,
    J

  • HI J
    we reproduced this problem in another unit, which also is a single unit connected to linux, however when I tested with testpmd, it has no RX lost on initial state or reverse mode at first time, but I can see limited missing after several test this time, I have no clearly idea why the RX was missed last time in previous unit or after several tests this time , it is not good, i guess it likely comes from the status of network card or tools but wasn't real cause.

    Test by testpmd when reproduced

    testpmd> clear port stats 0
    
      NIC statistics for port 0 cleared
    testpmd> set fwd mac
    Set mac packet forwarding mode
    testpmd> start
    mac packet forwarding - ports=1 - cores=1 - streams=1 - NUMA support enabled, MP allocation mode: native
    Logical Core 3 (socket 0) forwards packets on 1 streams:
      RX P=0/Q=0 (socket 0) -> TX P=0/Q=0 (socket 0) peer=02:00:00:00:00:00
    
      mac packet forwarding packets/burst=32
      nb forwarding cores=1 - nb forwarding ports=1
      port 0: RX queue number: 1 Tx queue number: 1
        Rx offloads=0x0 Tx offloads=0x0
        RX queue: 0
          RX desc=256 - RX free threshold=0
          RX threshold registers: pthresh=0 hthresh=0  wthresh=0
          RX Offloads=0x0
        TX queue: 0
          TX desc=256 - TX free threshold=0
          TX threshold registers: pthresh=0 hthresh=0  wthresh=0
          TX offloads=0x0 - TX RS bit threshold=0
    testpmd> show port stats 0
    
      ######################## NIC statistics for port 0  ########################
      RX-packets: 122        RX-missed: 0          RX-bytes:  14494
      RX-errors: 0
      RX-nombuf:  0         
      TX-packets: 88         TX-errors: 0          TX-bytes:  10011
    
      Throughput (since last show)
      Rx-pps:            0          Rx-bps:            0
      Tx-pps:            0          Tx-bps:          248
      ############################################################################
    testpmd>
    testpmd> show port stats 0
    
      ######################## NIC statistics for port 0  ########################
      RX-packets: 494        RX-missed: 0          RX-bytes:  59520
      RX-errors: 0
      RX-nombuf:  0         
      TX-packets: 460        TX-errors: 0          TX-bytes:  55037
    
      Throughput (since last show)
      Rx-pps:            1          Rx-bps:         1616
      Tx-pps:            1          Tx-bps:         1616
      ############################################################################
    testpmd> 
    testpmd> stop
    Telling cores to stop...
    Waiting for lcores to finish...
    
      ---------------------- Forward statistics for port 0  ----------------------
      RX-packets: 470            RX-dropped: 0             RX-total: 470
      TX-packets: 470            TX-dropped: 0             TX-total: 470
      ----------------------------------------------------------------------------
    
      +++++++++++++++ Accumulated forward statistics for all ports+++++++++++++++
      RX-packets: 470            RX-dropped: 0             RX-total: 470
      TX-packets: 470            TX-dropped: 0             TX-total: 470
      ++++++++++++++++++++++++++++++++++++++++++++++++++++++++++++++++++++++++++++
    
    Done.


    Test when enabled reverse mode
    testpmd> clear port stats 0
    
      NIC statistics for port 0 cleared
    testpmd> set fwd mac
    Set mac packet forwarding mode
    testpmd> start
    mac packet forwarding - ports=1 - cores=1 - streams=1 - NUMA support enabled, MP allocation mode: native
    Logical Core 3 (socket 0) forwards packets on 1 streams:
      RX P=0/Q=0 (socket 0) -> TX P=0/Q=0 (socket 0) peer=02:00:00:00:00:00
    
      mac packet forwarding packets/burst=32
      nb forwarding cores=1 - nb forwarding ports=1
      port 0: RX queue number: 1 Tx queue number: 1
        Rx offloads=0x0 Tx offloads=0x0
        RX queue: 0
          RX desc=256 - RX free threshold=0
          RX threshold registers: pthresh=0 hthresh=0  wthresh=0
          RX Offloads=0x0
        TX queue: 0
          TX desc=256 - TX free threshold=0
          TX threshold registers: pthresh=0 hthresh=0  wthresh=0
          TX offloads=0x0 - TX RS bit threshold=0
    testpmd> show port stats 0
    
      ######################## NIC statistics for port 0  ########################
      RX-packets: 297        RX-missed: 0          RX-bytes:  53826
      RX-errors: 0
      RX-nombuf:  0         
      TX-packets: 1          TX-errors: 0          TX-bytes:  253
    
      Throughput (since last show)
      Rx-pps:            0          Rx-bps:            0
      Tx-pps:            0          Tx-bps:            0
      ############################################################################
    testpmd> stop
    Telling cores to stop...
    Waiting for lcores to finish...
    
      ---------------------- Forward statistics for port 0  ----------------------
      RX-packets: 18             RX-dropped: 0             RX-total: 18
      TX-packets: 18             TX-dropped: 0             TX-total: 18
      ----------------------------------------------------------------------------
    
      +++++++++++++++ Accumulated forward statistics for all ports+++++++++++++++
      RX-packets: 18             RX-dropped: 0             RX-total: 18
      TX-packets: 18             TX-dropped: 0             TX-total: 18
      ++++++++++++++++++++++++++++++++++++++++++++++++++++++++++++++++++++++++++++
    
    Done.


    test after reset by setting 0x0000 to 0x8000
    testpmd> clear port stats 0
    
      NIC statistics for port 0 cleared
    testpmd> 
    testpmd> 
    testpmd> set fwd mac
    Set mac packet forwarding mode
    testpmd> start
    mac packet forwarding - ports=1 - cores=1 - streams=1 - NUMA support enabled, MP allocation mode: native
    Logical Core 3 (socket 0) forwards packets on 1 streams:
      RX P=0/Q=0 (socket 0) -> TX P=0/Q=0 (socket 0) peer=02:00:00:00:00:00
    
      mac packet forwarding packets/burst=32
      nb forwarding cores=1 - nb forwarding ports=1
      port 0: RX queue number: 1 Tx queue number: 1
        Rx offloads=0x0 Tx offloads=0x0
        RX queue: 0
          RX desc=256 - RX free threshold=0
          RX threshold registers: pthresh=0 hthresh=0  wthresh=0
          RX Offloads=0x0
        TX queue: 0
          TX desc=256 - TX free threshold=0
          TX threshold registers: pthresh=0 hthresh=0  wthresh=0
          TX offloads=0x0 - TX RS bit threshold=0
    testpmd> show port stats 0
    
      ######################## NIC statistics for port 0  ########################
      RX-packets: 515        RX-missed: 14         RX-bytes:  62448
      RX-errors: 0
      RX-nombuf:  0         
      TX-packets: 3          TX-errors: 0          TX-bytes:  529
    
      Throughput (since last show)
      Rx-pps:            0          Rx-bps:            0
      Tx-pps:            0          Tx-bps:            0
      ############################################################################
    testpmd> show port stats 0
    
      ######################## NIC statistics for port 0  ########################
      RX-packets: 522        RX-missed: 14         RX-bytes:  63007
      RX-errors: 0
      RX-nombuf:  0         
      TX-packets: 10         TX-errors: 0          TX-bytes:  1088
    
      Throughput (since last show)
      Rx-pps:            2          Rx-bps:         1632
      Tx-pps:            2          Tx-bps:         1632
      ############################################################################
    testpmd> 
    testpmd> show port stats 0
    
      ######################## NIC statistics for port 0  ########################
      RX-packets: 527        RX-missed: 14         RX-bytes:  63638
      RX-errors: 0
      RX-nombuf:  0         
      TX-packets: 15         TX-errors: 0          TX-bytes:  1719
    
      Throughput (since last show)
      Rx-pps:            2          Rx-bps:         2296
      Tx-pps:            2          Tx-bps:         2296
      ############################################################################
    testpmd> 
    testpmd> show port stats 0
    
      ######################## NIC statistics for port 0  ########################
      RX-packets: 544        RX-missed: 14         RX-bytes:  66240
      RX-errors: 0
      RX-nombuf:  0         
      TX-packets: 32         TX-errors: 0          TX-bytes:  4321
    
      Throughput (since last show)
      Rx-pps:            1          Rx-bps:         1656
      Tx-pps:            1          Tx-bps:         1656
      ############################################################################
    testpmd> 
    testpmd> 
    testpmd> show port stats 0
    
      ######################## NIC statistics for port 0  ########################
      RX-packets: 661        RX-missed: 14         RX-bytes:  80103
      RX-errors: 0
      RX-nombuf:  0         
      TX-packets: 149        TX-errors: 0          TX-bytes:  18184
    
      Throughput (since last show)
      Rx-pps:            1          Rx-bps:         1456
      Tx-pps:            1          Tx-bps:         1456
      ############################################################################
    testpmd> stop
    Telling cores to stop...
    Waiting for lcores to finish...
    
      ---------------------- Forward statistics for port 0  ----------------------
      RX-packets: 160            RX-dropped: 0             RX-total: 160
      TX-packets: 160            TX-dropped: 0             TX-total: 160
      ----------------------------------------------------------------------------
    
      +++++++++++++++ Accumulated forward statistics for all ports+++++++++++++++
      RX-packets: 160            RX-dropped: 0             RX-total: 160
      TX-packets: 160            TX-dropped: 0             TX-total: 160
      ++++++++++++++++++++++++++++++++++++++++++++++++++++++++++++++++++++++++++++
    
    Done.


    The bit9 of 0x0000 didn't work;
    I changed to MII loopback, eth0 keeps down(dont know the reason, but normal unit can up with mii mode),so ping doesn't work,so I am powerless as there is no any tool integrated in our unit can send packet like pktgen/testpmd
    ~ # ip a
    1: lo: <LOOPBACK,UP,LOWER_UP> mtu 65536 qdisc noqueue state UNKNOWN group default qlen 1000
        link/loopback 00:00:00:00:00:00 brd 00:00:00:00:00:00
        inet 127.0.0.1/8 scope host lo
           valid_lft forever preferred_lft forever
        inet6 ::1/128 scope host 
           valid_lft forever preferred_lft forever
    2: eth0: <NO-CARRIER,BROADCAST,MULTICAST,UP> mtu 1500 qdisc fq state DOWN group default qlen 1000
        link/ether e8:27:25:13:21:61 brd ff:ff:ff:ff:ff:ff
    ~ # 
    ~ # 


    In terms of our investigation so far, can we get the conclusion that the MDI side is okay? Because we can get the expected packet number on TX compared to RX. I think you have better understanding on testpmd based on pktgen-DPDK.

    Thank you!

  • If assume the problem closer to MAC side, what is the recommended way for debugging,
    For example

    1.use a force way. that's   force-link 100M-full, no-autonego. (need to set on both sides)

    2.phy-tx-phase adjust if phy-device can support

    We prefer adjust the phase to verify again, could you give advice and guide us more, really appreciate if you have more insights

    Thank you J

  • Hi Chris, 

    I agree that the MDI side seems fine. This could be happening because the PHY uses RMII and there can be some issues with RMII in regard to the FIFO and clock. 

    Were you able to check the ppm of the crystal going into the PHY?
    Also, could you set the RMII elasticity buffer size to the max and see if the problem occurs?
    You can set bit [1:0] on register 17h to 00. Increasing the buffer size will increase the tolerance for frequency variation between RMII clock and the recovered data. 

    Best,
    J

  • Hi J,

    I'm working together with Chris. Now we have modified the REG (0x0017) as you suggested. And two units has run for 2 days and still working. Before it may reproduce after ~1 day. That's a good flag. When reading detail for REG 0x0017, I found the bit[3] is always 1 in our device, is this indicate some issue? And when we change the bit[1:0] from 1 to 0 it increase the tolerance, is this error due to the clock doesn't match? Could you give a little more info about it. Thanks.

    Best Regards,

    Hermes

  • Hi Chenhui, 

    It is good to hear. The error may have been happening because there was a clock mismatch somewhere in the RMII signal connection. The issue may have come from a oscillator/crystal that does not meet the ppm requirements. Increasing the size of the elasticity buffer increases the ppm tolerance so that seems to be the reason why the error has disappeared. 

    If the RMII FIFO is keep overflowing, could you lower the frequency tolerance and see if it persists?

    Best,
    J

  • Hi J,

    All our units use the default value 01 in REG17[1:0] which is the minimum value of the tolerance now, but only some units have this issue. Actually my question is when we read the REG17 we see the [3] is 1 for all the units, is that mean the RX FIFO overflow is already happen? Is that an issue or risk?

    Best Regards,

    Hermes 

  • Hi Chenhui,

    I suggest to double check the ppm of the XI clock. It could be happening because the ppm of the clock is higher than recommended.

    Best,

    J

  • Hi J,

    Thanks for the quick reply. Yes, we will double check and we plan to use an external oscillator to have a check. BTW today I read the REG17 from the units, it change to 0x60 which the RX overflow bit is gone after I change the tolerance to 00. That's also a good flag, I guess.

    Best  Regards,

    Hermes

    • Hi Chenhui,

    The FIFO status bits are only cleared on read so overflow may have happened at some point, but has not happened since.

    Best,

    J

  • Hi J,

    So if I read the REG17 repeatly, I always get the RX overflow bit is 1, which means the RX FIFO overflow is continues happen? 

    root@axis-e8272522202a:~# /tmp/phytool read eth0/1/0x0017
    0x0065
    root@axis-e8272522202a:~# /tmp/phytool read eth0/1/0x0017
    0x0065
    root@axis-e8272522202a:~# /tmp/phytool read eth0/1/0x0017
    0x0065
    root@axis-e8272522202a:~# /tmp/phytool read eth0/1/0x0017
    0x0065
    root@axis-e8272522202a:~# /tmp/phytool read eth0/1/0x0017
    0x0065
    root@axis-e8272522202a:~# /tmp/phytool read eth0/1/0x0017
    0x0065
    root@axis-e8272522202a:~# /tmp/phytool read eth0/1/0x0017
    0x0065
    root@axis-e8272522202a:~# /tmp/phytool read eth0/1/0x0017
    0x0065
    root@axis-e8272522202a:~# /tmp/phytool read eth0/1/0x0017
    

    Best Reagrds,

    Hermes

  • Hi Chenhui,

    There could be a chance.I will have to further investigate however.

    Best,

    J

  • Hi J:

         I'm electronic engineer working with Chris & Hermes, about the XI input on the PHY, we used RMII master mode on the DP83822, that means we used the 25Mhz clock from SOC to XI, and PHY generate 50Mhz back to SOC for RMII, we also reserve the pad for external crystal 25MHz, I attached the schematic files for your reference which has been reviewed by TI team before.

    M3925-R_Main_schematic.pdf

         I also suspected the Clock from our SOC, and I checked the PPM is no more than 20PPM (around 12PPM), so I have tried to use external crystal, and the issue still happening, but I still captured the external crystal PPM when the issue happened, the PPM is even lower about 3PPM.

    25Mhz from SOC25Mhz from external crystal

         I checked the REG17 bit 1:0 about the elasticity buffer size, it allows for the frequency variation tolerance between 50Mhz and recovered data, can you explain deeper about what's the "50Mhz" and "recovered data" in our use case, does the "50Mhz" means the output from PHY to SOC? As the experiment show the XI from SOC or external crystal seems good and the issue happened on both clock, it seems shouldn't be related with the XI clock.

         Thank you!

         Best,

         Ted


  • Hi J,

    Sorry, I need to correct one thing, the REG17 shows 0x0065 which is bit2 set, so it's RX FIFO underflow, not overflow.

    Best  Regards,

    Hermes

  • Hi Chenhui and Wenjun, 

    Thank you for the detailed information. It seems so that this issue is not happening because of the XI clock but for some reason increasing the elasticity buffer size helped. 


     I checked the REG17 bit 1:0 about the elasticity buffer size, it allows for the frequency variation tolerance between 50Mhz and recovered data, can you explain deeper about what's the "50Mhz" and "recovered data" in our use case, does the "50Mhz" means the output from PHY to SOC? As the experiment show the XI from SOC or external crystal seems good and the issue happened on both clock, it seems shouldn't be related with the XI clock.

    Yes, 50 MHz in your case would be the clock that is provided by the PHY to the MAC. Recovered data means the data that was processed from the MDI side to the RMII FIFO. 

    Based on this, I was wondering why the buffer is keep underflowing. One thing I wanted to suggest is decreasing the IPG or increasing the packet size would prevent FIFO underflow. 

    Best,
    J

  • Hi J:

         Update a little about the PPM, actually the PPM is not measured on when the issue exactly happened, it is measured after we found the network is lost, it is very difficult to keep monitoring the PPM value because we don't know when it will drop the link, but as Chenhui said, the underflow is continuously happening, if it is related with clock PPM, I believe I can always measure and get a large PPM result.

         Will the underflow status be affected by clock PPM like overflow?


  • Hi Wenjun,

    I am not entirely sure why underflow is happening. One reason can be XI clock’s ppm but also I am wondering if it depends on how packets are being sent in your system which is why i suggested to send packets differently.

    Underflow status would mean that the MII side is grabbing packets faster than the packets coming in from the MDI side. So, this can be an application-specific issue, or if there are any HW issue that contributes to underflow.

    Best,

    J

  • HI J,
    After setting the [1:0] bit of 0x0017 to 0x00, the network finally lost with a longer testing. I compared the register to the initial log when network down(right side). seems link partner enter the wrong state, could you please share more thoughts from this test result?

  • Hi Chris, 

    That is unfortunate to hear. 

    Do you know if there is a lot of traffic when the network connection is lost? I wonder if there is power droop when the network stability is lost. 

    I noticed that the value of register 17h changes. This changes the bit [1:0] so the size of elasticity buffer most likely changed and that may have crashed the network. 

    Could you confirm where the register writes may be happening?

    Best,
    J

  • Hi J
    I want to clarify that the right column register is the network-lost unit with default setting( didn't increase the size of elasticity buffer). I dont know if it is meaningful to do comparison with the buffer-increased failed test(the left column). i am wonder the network connection shouldn't worse when we increase buffer, or it shouldn't have the negative effect right? do we have any other clues could be verified further?
    Thank you for your suggestion.

  • Hi Chris, 

    Thank you for the clarification. I looked at the comparison of the registers and I do not see any notable configuration changes. In this case, there may be an issue on the MAC side. Do you have any dmesg log on the MAC side when the network goes down?

    Best,
    J

  • HI J,
    It only has startup log but no valuable info when network goes down, if there are any debug log you suggested can be looked into we will try to get it.
    Thank you!

    ambarella-dwmac-eqos ffe000e000.ethernet eth0: PHY [stmmac-0:01] driver [TI DP83822] (irq=POLL)
    ambarella-dwmac-eqos ffe000e000.ethernet eth0: Register MEM_TYPE_PAGE_POOL RxQ-0
    dwmac4: Master AXI performs fixed burst length
    ambarella-dwmac-eqos ffe000e000.ethernet eth0: No Safety Features support found
    ambarella-dwmac-eqos ffe000e000.ethernet eth0: No MAC Management Counters available
    ambarella-dwmac-eqos ffe000e000.ethernet eth0: IEEE 1588-2008 Advanced Timestamp supported
    ambarella-dwmac-eqos ffe000e000.ethernet eth0: configuring for phy/rmii link mode
    simple-card: Ambarella fix DAI clock at 12288000.
    simple-card: Ambarella fix DAI clock at 12288000.
    ambarella-dwmac-eqos ffe000e000.ethernet eth0: Link is Up - 100Mbps/Full - flow control off
    MACsec IEEE 802.1AE
  • Hi Chris, 

    I noticed that there is no log for link dropping. Does the link ever get dropped? 

    Also, we may need to get MII loopback working somehow. It seems somewhere in the MII path is breaking and I am unsure what is breaking at the moment. 

    I know you have previously used MII loopback mode, but that did not work because the link was not up. 

    Can you try doing a MII loopback with digital loopback? These loopback modes should give you a link status so you should be able to send packets to see if the MII path is working all the time. 


    You can set register 16h to 04h to enable digital loopback. 

    Best,
    J

  • Thank you J,

    I can see the link ip, what you mean send packets is send from device to the HOST right? Regarding MII path,unfortunately I can't make it since the device has limited tools to do that.

    ~ # ip a
    1: lo: <LOOPBACK,UP,LOWER_UP> mtu 65536 qdisc noqueue state UNKNOWN group default qlen 1000
        link/loopback 00:00:00:00:00:00 brd 00:00:00:00:00:00
        inet 127.0.0.1/8 scope host lo
           valid_lft forever preferred_lft forever
        inet6 ::1/128 scope host 
           valid_lft forever preferred_lft forever
    2: eth0: <BROADCAST,MULTICAST,UP,LOWER_UP> mtu 1500 qdisc fq state UP group default qlen 1000
        link/ether e8:27:25:13:4e:f9 brd ff:ff:ff:ff:ff:ff
        inet 169.254.167.167/16 scope link eth0
           valid_lft forever preferred_lft forever
        inet6 fe80::ea27:25ff:fe13:4ef9/64 scope link 
           valid_lft forever preferred_lft forever
    ~ # 
    ~ # ./phyrw.sh r 0x0016
    0x0144
    
    ~ # ping 169.254.78.31
    No response from 169.254.78.31
    ~ # ip -s link show eth0
    2: eth0: <BROADCAST,MULTICAST,UP,LOWER_UP> mtu 1500 qdisc fq state UP mode DEFAULT group default qlen 1000
        link/ether e8:27:25:13:4e:f9 brd ff:ff:ff:ff:ff:ff
        RX:    bytes  packets errors dropped  missed   mcast           
          4534792374 62264419      0       0       0       0 
        TX:    bytes  packets errors dropped carrier collsns           
        156619724437 31208994      0       0       0       0 
    ~ # 
    

  • Hi Chris, 

    You are on the right track. If you enable promiscuous mode on Linux, the packets sent out by the MAC will be looped back to the MAC, but not dropped so you should see the packet counter incremented after the ping is over. 

    The test procedure I suggest is as such:
    1. Write 0x16 = 0x0104 to the PHY register.
    2. Check the current packet status via ip -s link show eth0 or sudo ethtool -S
    3. ping ip address
    Please note that the ping will not work since the packets are being looped back.
    4. Cancel ping and check the packet status again. We should be able to see packets incrementing if the MII path is okay all the time. 

    Best,
    J

  • HI J,
    Thank you and I tested as you said.
    When I set 0x0104 for 0x16 on normal unit, the packet keeps growing on both RX and TX side.
    On net-lost reproduced unit, I cannot see the RX packet incrementing when enable  promiscuous mode and ping IP address. so it keeps same conclusion that MII path was broken at that time, compared to the normal unit

    ~ # ./phyrw.sh r 0x0016 
    
    0x0100 
    
    ~ # ./phyrw.sh w 0x0016 0x0104 
    
    ~ # ./phyrw.sh r 0x0016 
    
    0x0104 
    
    ~ #  
    
    ~ #  
    
    ~ # ip -s link show eth0 
    
    2: eth0: <BROADCAST,MULTICAST,PROMISC,UP,LOWER_UP> mtu 1500 qdisc fq state UP mode DEFAULT group default qlen 1000 
    
        link/ether e8:27:25:13:4e:f9 brd ff:ff:ff:ff:ff:ff 
    
        RX:    bytes  packets errors dropped  missed   mcast            
    
          3962834638 50563983      0       0       0       0  
    
        TX:    bytes  packets errors dropped carrier collsns            
    
        132489338727 33215264      0       0       0       0  
    
    ~ #  
    
    ~ # ip a 
    
    1: lo: <LOOPBACK,UP,LOWER_UP> mtu 65536 qdisc noqueue state UNKNOWN group default qlen 1000 
    
        link/loopback 00:00:00:00:00:00 brd 00:00:00:00:00:00 
    
        inet 127.0.0.1/8 scope host lo 
    
           valid_lft forever preferred_lft forever 
    
        inet6 ::1/128 scope host  
    
           valid_lft forever preferred_lft forever 
    
    2: eth0: <BROADCAST,MULTICAST,PROMISC,UP,LOWER_UP> mtu 1500 qdisc fq state UP group default qlen 1000 
    
        link/ether e8:27:25:13:4e:f9 brd ff:ff:ff:ff:ff:ff 
    
        inet 169.254.167.167/16 scope link eth0 
    
           valid_lft forever preferred_lft forever 
    
        inet6 fe80::ea27:25ff:fe13:4ef9/64 scope link  
    
           valid_lft forever preferred_lft forever 
    
    ~ #  
    
    ~ # ping 169.254.78.31 
    
    No response from 169.254.78.31 
    
    ~ # ip -s link show eth0 
    
    2: eth0: <BROADCAST,MULTICAST,PROMISC,UP,LOWER_UP> mtu 1500 qdisc fq state UP mode DEFAULT group default qlen 1000 
    
        link/ether e8:27:25:13:4e:f9 brd ff:ff:ff:ff:ff:ff 
    
        RX:    bytes  packets errors dropped  missed   mcast            
    
          3962834638 50563983      0       0       0       0  
    
        TX:    bytes  packets errors dropped carrier collsns            
    
        132489353636 33215352      0       0       0       0  
    
    ~ #  


  • Hi Chris, 

    I agree that the MII path is not working. Can you make sure RMII traces are all length-matched and within 6000 mils on the layout? In addition, if this is caused by timing violation on the RMII path, enabling TX clock shift may fix the issue. You can enable this feature by setting bit 8 of register 17h high. 


    Please let me know. 

    Best,
    J

  • Hi J:

    About the length-matched situation of RMII traces, I checked before, the max difference is on the TXD0 compare with reference CLK, but it is still fulfill the requirement of DP83822, but anyway we will try to improve this in next batch, by the way, for RMII traces, does the length-matched requirement include the input clock which in our case is 25Mhz from SOC?

    ETH_CRS_DV

    57.507mm

    ETH_TXD0_POC14

    74.978mm

    ETH_TXD1_POC1

    67.439mm

    ETH_TXEN

    64.632mm

    ETH_RXD0

    63.063mm

    ETH_RXD1

    60.957mm

    ETH_CLK_RX

    62.332mm

    For the RMII TX Clock Shift you suggested, I remember we have tried this before and the issue still exists, but anyway, Chris will try to do that again.

  • Hi Wenjin,

    Understood. XI clock path does not have to be length matched. We typically recommend MII path to be within 50 mils length matched. This is around 1.27 mm. Therefore, MII path definitely is out of our recommendation.

    You can refer to this document for more information: 

    https://www.ti.com/lit/an/snla387/snla387.pdf?ts=1773744254749

    If TX clock shift does not work, length matching RMII path would be the best solution in my opinion. If the current version of the board will be used, increasing the RMII FIFO size as we previously investigated would be the best workaround I can offer.
    Best,

    J