


Part Number: LMH1219
There is a figure expressed by the first derivative in the data sheet.
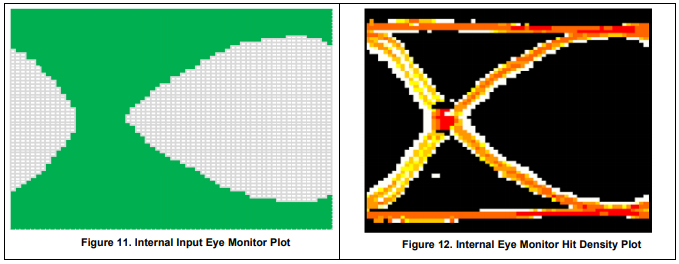
Figure 11 represents the data I read,(Same information read from LMH1219)
Figure 12 represents the first derivative.
In my opinion, it takes special processing to make it like "SigCon Architect" data.
A detailed explanation of the first derivative is needed.
I would appreciate it if you could explain it using examples.

