This thread has been locked.

If you have a related question, please click the "Ask a related question" button in the top right corner. The newly created question will be automatically linked to this question.

MCU-PLUS-SDK-AM243X: SYSCONFIG and compile time very slow

Part Number: MCU-PLUS-SDK-AM243X
Other Parts Discussed in Thread: SYSCONFIG

Hi all,

I have two issues:

1. My M4 core will only launch sometimes

I haven't been able to find anything in my code to cause this, but if I build the exact same code 9/10 times it will load with no symbols. I can't open the ROV, see the stack, or anything. There's not much running on this core, but I've tried to increase the stack size of the tasks and no difference is made.

If I'm lucky, it will sometimes just work - no changes, I just need to keep trying and it will eventually load. I'm not sure what's changed to lead to this. Any help/suggestions are greatly appreciated.

2. sysconfig is really, really slow now

Is it normal for a multicore project using a lot of peripherals to be such a challenge for CCS 12?

It takes about 20 minutes now to just open a syscfg file from a project I'm working on. It's using most GPIO pins and other peripherals across all 5 cores, so it is comprehensive, but the time still seems disproportionate.

It also takes me about 20 minutes to run debug for the full multi core project, or 3 minutes for an individual core. This is very frustrating when I might forget to run the DSMC initialisation script between attempts, which means it's then 40 minutes.

I know a part of the reason is that I do a full make clean before each build, which was the only way I could get a multicore project to actually build properly. But it seems to largely be the sysconfig portion.

Is there something I can do to speed things up? I'm using pretty powerful computers, so I'm surprised at how my dev has crawled to a snails pace with CCS.

  • Hello Tron,

    Are you using a TI EVM for the AM243x such as the LaunchPad or EVM or are you using custom hardware?

    Are you using the latest versions of CCS and MCU+ SDK? 

    I am checking internally if there are solutions to speed up your project build time. 

    Regards,

    Erik

  • Thanks Erik. We're using the LP, CCS 12.5.0.00007 and 08_06_00_43 (can't use 09 because it's incompatible with our LPs).

  • HI Tron,

    I just did a quick test that opening the M4FSS0 hello_world sysconfig GUI takes less than 3 seconds, and compiling takes <50 seconds. 

    It takes 45 seconds to compile MibSPI loopback project for R5F core

  • Sure. But if you, say, add each of the GPIO pins available on the LP in Sysconfig, Sysconfig becomes unusable and the compile time skyrockets.

  • M4FSS0 hello_world:

    I added 5 GPIOs (MCU domain has 5 GPIOs) to the project, compiling the MCU project takes 43 second.

  • Can you share your sysconfig file for your R5F project?

  • Thanks, QJ. 5 pins isn't enough - we're using most of the 80 pins available on the Launchpad. It's not just the M4 core (although, we keep having issues with the M4 core) it's the whole multicore project that is lagging on build.

    The file upload isn't working for me here - do you have an email address I can send my sysconfig files to?

    This is the time it just took me to open a Sysconfig file from my project. Sysconfig is so bogged down that I can't even edit settings using it anymore - every keystroke takes a couple of minutes to process - I need to modify it using a text editor and hope I haven't made any errors (which was a mighty pain setting up given the number errors and discrepancies between the manuals and schematics). It's the same on any PC we try it on, no matter how powerful.

    Given how problematic the Sysconfig tool is, I assume this is why the build process takes so long - it repeats the same tedious Sysconfig process for each of the 5 cores we're working with.

  • I just sent you a friend request. Please attach your sysconfig file over there. Thanks

  • Thanks, QJ. How did you go?

  • Hi Tron,

    Please see my response in private message. 

  • There is no time difference to open your example.sysconfig for m40-0 and r5f0-0 (<4 seconds) and compile the project for m40-0 and r5f0-0(<50 seconds)

  • Hi QJ. When I open one of the .sysconfig files in a multicore project it opens them all at the same time and checks that there are no conflicting assignments between the cores - did you try this, or just one at a time independently?

    My compile time (and time to load/modify Sysconfig) goes to near zero when I remove all of the sysconfig peripherals. I've tested this myself on 3 different Windows PCs, each running CCS 12, and it's the same story.

    EDIT: I do note that if I open them individually using the standalone Sysconfig tool it loads instantly, but I can't load them as a multi core project in this tool to compare it's performance with the CCS plugin that is also used for the build process.

    On a side note, how long do you think it will be until Theia has Sitara/AM243X support?

  • The straw has broken the camels back. we can't add any more peripherals using Sysconfig.

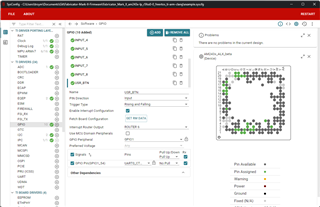
    I'm trying to add the LPs user button, after about 5 minutes of waiting when I select the pin (B9), which is confirmed free, Sysconfig crashes. That's fine, because I can add it using the desktop version of System Configuration Tool easily enough, but then I can't compile the project - probably because the CCS version of Sysconfig is still being used in the background trying to generate the Sysconfig files and crashing.

    If we can't solve this we're going to have to switch to a non-TI product, because TI products seem unable to do what they claim and it's costing a lot of time and money.


  • Does this mean anything useful?

  • Hello Tron,

    First of all, I apologize for the delay in response and I acknowledge that this has been a frustrating experience. The issue that you are facing is a known issue that we have been debugging. 

    Recently I developed a potential workaround for the issue and I would like to use your project as a test case. Could you please send me your entire CCS project? QJ is out for the holiday break and so I can't get the project from him.

    I sent you a friend request so that you can send me the zip file over direct message.

    Regards,

    Erik

  • Hi Erik. No worries. Will DM you the files now.

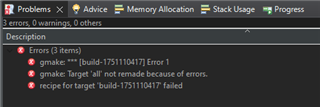
    In the meantime I worked out I can (sort of) avoid a lot of the build time by avoiding using gmake clean - the problem with that is that about 50% of the time the build process doesn't build properly but also doesn't produce any errors, and I can spend more time debugging a non-code-issue when I should have just cleaned and waited another 6 minutes to make sure it was all built properly from scratch.

    This process has also raised another issue I have where often I need to restart CCS for the context menu option to clean or build will actually work - clicking them will look like they work, but nothing is actually being done, until I restart the IDE entirely.

    Combine that with trying to maintain my flow but forgetting to do one of the following exactly correctly: reset the AM243, launch the correct debug config, wait until it loads, then load the dsmc.js, wait until it's complete, and then hitting debug - usually before realising I did something out of order and I need to restart CCS entirely again because now the scripting console is hung and I've forgotten what I was trying to test - the whole process is very tedious.

  • Hello Tron,

    I apologize for the delay in my response, I have just now returned from the holiday break. I received your project and I will consult with other team members on the best solution for the issue you are facing as well as test the aforementioned workaround. Since some experts are still on break through the end of this week there may be some delay in response. 

    I acknowledge that this is a frustrating development flow and we are working to try and help you as quick as possible

    Regards,

    Erik

  • Thanks, Erik. Sadly the workaround bought me some time, but I'm stuck again. I need to add a new HW timer but the Sysconfig solver crashes with the same Out Of Memory error as before. Is there a way I can force Sysconfig to increase the memory it's allowed to use? I assume that's going to be easier than waiting for a more efficient solver.

  • Hello Tron,

    We are still working on trying to patch the SDK to help you with the issue. Could you please change all GPIO Peripherals that are assigned to "Any" to be "GPIO1" and lock the value? This should help the solver until we can patch the issue. 

    Please let me know if that helps and I will provide updates on the patch when that is available.

    Regards,

    Erik

  • Thanks, Erik. We've explicitly determined the allocations to match the PCB we place on top and because it causes too many issues to let Sysconfig decide.

    Will the patch be available for older AM243X launchpads? We don't want to replace all of our development boards just because of the recent hs-fs update that makes ours incompatible with MCU+ v9+.

    Do you have any indication on whether the patch is likely to solve my first question, too? We're still having trouble with the M4F core sometimes deciding to have symbols defined and other times not when building the same project without any changes. Since opening this thread and developing other cores of our project it's now impossible to get the M4F core to boot at all, and after several days dedicated to debugging this the only change I can put it down to is having added two timer modules to an R4F core in Sysconfig. This is something seemingly unrelated, but it was always going to be as the M4F core project hasn't changed at all in months.

    EDIT: I've just noticed something interesting. The M4 core will not load symbols on the first debug session after I've fully reset power and run the dsmc script - but it will work if I load it any number of times immediately again without resetting the power.

    The reason I haven't found this before is that I have to do a full reset when debugging with multi-cores, because the sciclient is reconfigured by one of the other cores to set up GPIO bank interrupts. What would be happening so that it will load correctly only if I debug twice in a row?

    EDIT 2: Ok, even that has limits. I sometimes get this error when I try and load it again, which I'd think should happen every time given it's hard faulting the first time every time:
    BLAZAR_Cortex_M4F_0: Can't Run Target CPU: (Error -1268 @ 0x1090001) Device is locked up in Hard Fault or in NMI. Reset the device, and retry the operation. If error persists, confirm configuration, power-cycle the board, and/or try more reliable JTAG settings (e.g. lower TCLK). (Emulation package 9.13.0.00201)

  • Hello Tron,

    We have been working on this syscfg crash issue and putting efforts to not break the backward compatibility. 

    "Do you have any indication on whether the patch is likely to solve my first question, too?" 

    By first question, do you mean the expansion of memory? If so, then is this something which you still require after locking the pins?

    We have confirmed from our tools team that the memory limitation that we run into with the GPIOs cannot be increased. For now we can lock the pins to solve it.

    For the M4 question, please allow us some more time to investigate and get back to you.

  • Thanks for touching base, Sudeshna. That sounds great.

    The first question is around the M4F core experiencing a hard fault, and doesn't appear to build/load correctly, when the Sysconfig of the other cores has a lot of peripherals configured as we've been discussing. It seems that if I take peripherals out, then it will build and load correctly - with no changes made at all to the M4F sysconfig or code. It also seems as though I can sometimes load the application for that core twice and it will then work, but sometimes it's already experienced a hard fault. I'm unsure what the pattern is. I've posted more on this in my last post above.

    I've always had all pins locked and explicitly defined, because I don't trust the solver. I assume there's a verification step, to ensure there are no conflicts, that uses the solver and is causing the problem.

  • Thanks for the reply, Tron.

    Did you try flashing SBL Null and then loading your project from CCS? Just wanted to understand if the dmsc flow is the issue or not.

  • Thanks Sudeshna. Yes, for development we're always using SBL NULL so we can debug with CCS. So SBL NULL is flashed and confirmed working, in CCS we launch the target configuration, run the dmsc script (Chill Capybar for our older boards - great naming) for our older boards) and wait for it to complete, and then if we initiate debug for either the system project of the M4F core project alone the problem described above occurs.

    Unrelated, is there a way to speed up accessing the MCU+ SDK documentation, it takes around 30-60 seconds to load a page and ~10 to expand a menu (Firefox and Chrome). Can I download a local copy via git or something?

  • Hello Tron,

    SBL_NULL when flashed will load the SYSFW which does the resource/ power management (you can do in OSPI boot mode) After that you can directly launch and connect to the core from CCS and load your .out . DMSC script also loads the SYSFW (in DEV boot mode). So you need to do either of the 2 and not both at the same time otherwise reloading of SYSFW might cause some issues to occur.

    For the documentation part I verified by opening it outside our TI network and able to get the same issue.
    Inside your installer folder can you find README_FIRST_AM243X.html file? This should resolve it.

  • Re. SBL_NULL, thanks, I'm already well aware of all that. That's not the problem. Slight smile

    Re. the documentation - perfect, thank you.

  • Hello Tron,

    Apologies if I'm misunderstanding your issue. What I could understand from above is that you're having trouble loading symbols to M4 core after running dmsc script. All I wanted to convey was to take the sbl_null path only instead of loading dmsc in case you have that flexibility. 

  • Hi Sudeshna. Oh, apologies - I misunderstood you. You're saying to:
    1. flash SBL NULL
    2. Manually load the .out, without debugging or running the dmsc script first?

    When I try that I get this error in CCS:
    Error connecting to the target:
    (Error -1170 @ 0x0)
    Unable to access the DAP. Reset the device, and retry the operation. If error persists, confirm configuration, power-cycle the board, and/or try more reliable JTAG settings (e.g. lower TCLK).
    (Emulation package 9.13.0.00201)

  • Hello Tron,

    Yes, that's what I meant. Loading dmsc script is not needed in this case.
    The error which you're getting is unexpected, I tried at my end as well and iI'm able to load it.

    Can you once confirm if below steps are what you're exactly doing?

    1. Flash SBL NULL in UART boot mode.

    2. Power off your EVM --> Change your boot mode to OSPI --> Turn the power ON

    3. Launch Selected Config (the am243x ccxml) --> Connect to the core (in your case M4) --> Load .out

  • Hi Sudeshna. Ah, I didn't set to OSPI bootmode, I was in no bootmode. When I tried that it loaded correctly.

    A challenge right now is that the M4F core has started building and launching correctly again - without any changes to the M4F code or sysconfig of course - so I can't say whether this is truly working or not and I can't debug this intermittent issue until it presents again - which I'm sure it will soon.

  • Hello Tron,

    I can understand your concern regarding this matter. If it appears again in future, I would recommend you to raise another ticket and we can assign to the subject expert.

  • Ok. Sounds good. In the meantime, let me know if there are any updates on the sysconfig issue because our project has heavily stalled as a result.

  • One of our computers is now rebuilding the Sysconfig for one of the cores every time. On this computer, building that now takes about ~20 minutes each for our configuration.

    A second computer is experiencing a similar issue, but for every core. It now takes over an hour to build the project because of Sysconfig.

    We're not running gmake clean, and the project on each workstation is a clone from a git repository so the discrepancy in operation shouldn't be a project-based configuration issue. Where else can we look to stop this process? We can't run our business with these kinds of problems.

  • Hello Tron,

    On the syscfg update thing, we require to do proper testing so that it does't affect any of the existing projects in SDK and the transition can be made smooth. We need some time to make it to the release.
    Till then may I know if you're facing any issue by locking the pins?

    For the 2nd issue, I've asked our internal team for help. Will update you.

  • Thanks. We've always had the pins locked. It makes no difference.

    I've managed to (at least temporarily) solve the second issue by removing the projects from the workspace before importing them again. I'm not sure why that made a difference, but both workstations are a little bit faster to build now.

  • Tron,

    • Go to your SysConfig directory
    • Backup dist\ui.js somewhere
    • Open dist\ui.js in a text editor (it's big, but notepad++ should open it fine)
    • Search for "this.minimizePeripheralUsage()," exactly (including the comma, but excluding the quotes)
    • Delete it and save

    As long as the pins and peripherals are locked, it should be performant now.  You can ensure everything is locked by selecting the tripple-dot menu in the upper-right corner, choosing "Preferences and Actions" and clicking on "Lock".

    You will have to do the same thing in cli.js to make the build equally as fast.

    I do not consider this the final "solution", especially since it requires you to lock all pins/peripherals.  We are working on a true solution that will not require this change to function, but this should at least get you past this hurdle.

    Darian

  • Thanks Darian. Much better now. It only takes ~2 minutes to open Sysconfig within CCS, and to build each core app from a cleaned state. Thanks.

    Out of curiosity, what is that minimisePeripheralUsage() function doing?

  • Although, 10 minutes to build the system project, while better than the >1 hour time it had grown to, is still probably longer than should be expected, no?

  • FYI I needed to remove the project and import them into the workspace again, because it was trying to rebuild the Sysconfig every time again. Reimporting seems to have fixed that so that it will only rebuild it if there's a change or it's been cleaned.

  • Tron,

    Without getting into too many details, the underlying issue is that the GPIO driver indicates what resources it needs in a way which is extremely inefficient for how the pinmux solver is designed.  The team is working to redefine this so as to match how it has been done on other devices where it's trivially fast.  The workaround of locking GPIO pins was intended to bypass what the solver is doing in order to remain performant, and it does for lower number of pins.  But the function I asked you to delete doesn't consider if things are locked, and so this function becomes a second performance issue as the number of pins increases further.

    As for what it does, it tries to ensure that a minimal number of peripherals are used by maximizing the number that are shared between drivers that are capable of sharing a peripheral.  This is done in order to reduce overall power used. In this case, it only affects sharing of the two GPIO banks between the GPIO drivers, which if you've locked down the pins is fixed anyway.

    As for how long it should take, after the fix it takes me 7 seconds to open all your scripts using the stand-alone version of SysConfig.  2 minutes seems excessive unless you have a slow PC.  Is it still slow to click around the UI and make changes now?  When you hit build, how long does it take between seeing the output line that includes "sysconfig_cli.bat" and the line saying "writing <path to generated file>"?  Anything outside of those lines is not SysConfig related and it something else (that said, it shouldn't be rebuilding SysConfig every time unless you're changing the script and hitting save)

    Darian

  • Thanks, Darian. That makes sense. Yes, using the standalone version of Sysconfig it takes negligible time to load. It's only the CCS version that takes a while, I assume because it's checking all the shared peripherals across cores unlike the standalone one.

     the problematic M4 core issue has come back again and I can repeat it - but it's very strange.

    All I did was change the value of a particular uint16_t variable in shared memory (address 0x701D8150) from '2000' to '20'. The variable (or any variables nearby) isn't used by the M4 core, it's relevant to other cores and isn't of any particular singificance to even those. It is initialised by all cores at the start of the boot process, via files that are shared with all of the core applications via links.

    The hard fault of the M4 core occurs as soon as the vTaskScheduler() function is called by main(), which I can confirm by stepping through the code. Strangely, a chunk of DebugP_log lines from code yet to be executed is instantly written to the CIO, much faster than the other cores are able to when actually running the code that produces it.

    All my cores all run the same shared memory initialisaiton code and none of the other cores experience any issue with this value. Just the M4 core, and if I change the value back to '2000' the M4 code doesn't hard fault.

  • Further, if I make the value '200' instead, the execution of M4 core executes further, crashing differently (no hard fault) with "Break at address "0xa5a5a5a4" with no debug information available, or outside of program code.".

    The other cores pass the the IPC_syncAll() function, while the M4 core seems to have crashed just after this but before the next DebugP_log line which writes that it was successful.

  • Ok, the most bizarre thing: if we change __IRQ_STACK_SIZE from 256 to 512 on the R5 core linker files (we're also getting hard faults on receiving IPC interrupts on some cores and trying to tease that out also - I'm beginning to suspect these are related issues), the M4 core gets caught by the hard fault handler. It feels like the M4 core will hard fault if the wind changes direction on the moon.

    I'm very lost on what could be causing this. Our code isn't particularly niche, but the integration of code for various peripherals very quickly reaches a complexity that the Launchpad just can't handle. Our project is completely stalled on these challenges and it's strangling our business, so any help would be greatly appreciated. Pray

  • Looking back through our notes, we had this issue a while back and a patchwork solution was to initialise the problematic struct in shared memory starting from index 1 rather than 0. Eventually we could remove this without any issue, I suspect because the ''shape' of the initialised struct had changed.

    This is how we declare the struct in shared memory. This file is linked across all cores, so we know the code is exectly the same for all:

    volatile peripheral_t   peripheralcfg[MAX_PERIPHERALS] __attribute__((aligned(32), section(".bss.user_shared_mem")));

    Now that the issue has appeared again, and noting that it's a problem with the value of this variable at this time, I've found that if I repeat the line immediately after having the former value being one that the M4 is ok with and then the actual value I want after then the M4 code will execute. Remember that this variable has nothing to do with the M4 core other than existing in shared memory. It appears to be an issue not with the value or the location of the variable, but maybe the location where this specific line of code is stored? Even if so, why would the first line work with a value of 2000 but not 1? Why does it execute differently but still hard fault if it's made to be 200? Why does repeating the line after mean it executes as intended?

        peripheralcfg[i].sensor.params.i2c.sample_rate      = 2000;
        peripheralcfg[i].sensor.params.i2c.sample_rate      = 1;

    EDIT: If I add this junk code at line 533 of the file, then it also doesn't hard fault. It seems as though the M4 code is sensitive to whatever instruction happens to be in this exact place in memory.

        peripheralcfg[i];
        peripheralcfg[i].sensor.params.i2c.sample_rate      = 1;

    There's plenty of memory so there shouldn't be any overflows, and there's only the one main task running on this core and it's basically empty at the moment.

    Noting that the shared memory does work across all cores, can someone please check if there's any obvious problem with the our M4 memory config?

    linker.cmd:

    /* make sure below retain is there in your linker command file, it keeps the vector table in the final binary */
    --retain="*(.vectors)"
    /* This is the stack that is used by code running within main()
     * In case of NORTOS,
     * - This means all the code outside of ISR uses this stack
     * In case of FreeRTOS
     * - This means all the code until vTaskStartScheduler() is called in main()
     *   uses this stack.
     * - After vTaskStartScheduler() each task created in FreeRTOS has its own stack
     */
    --stack_size=32768
    /* This is the heap size for malloc() API in NORTOS and FreeRTOS
     * This is also the heap used by pvPortMalloc in FreeRTOS
     */
    --heap_size=49152
    
    
    SECTIONS
    {
        /* This has the M4F entry point and vector table, this MUST be at 0x0 */
        .vectors:{} palign(8) > M4F_VECS
        .text:   {} palign(8) > M4F_IRAM     /* This is where code resides */
    
        .bss:    {} palign(8) > M4F_DRAM     /* This is where uninitialized globals go */
        RUN_START(__BSS_START)
        RUN_END(__BSS_END)
    
        .data:   {} palign(8) > M4F_DRAM     /* This is where initialized globals and static go */
        .rodata: {} palign(8) > M4F_DRAM     /* This is where const's go */
        .sysmem: {} palign(8) > M4F_IRAM     /* This is where the malloc heap goes */
        .stack:  {} palign(8) > M4F_IRAM     /* This is where the main() stack goes */
    
        /* Sections needed for C++ projects */
        .ARM.exidx:     {} palign(8) > M4F_IRAM  /* Needed for C++ exception handling */
        .init_array:    {} palign(8) > M4F_IRAM  /* Contains function pointers called before main */
        .fini_array:    {} palign(8) > M4F_IRAM  /* Contains function pointers called after main */
    
        /* General purpose user shared memory */
        .bss.user_shared_mem (NOLOAD) : {} > USER_SHM_MEM
        /* this is used when Debug log's to shared memory are enabled, else this is not used */
        //.bss.log_shared_mem  (NOLOAD) : {} > LOG_SHM_MEM
        /* this is used only when IPC RPMessage is enabled, else this is not used */
        //.bss.ipc_vring_mem   (NOLOAD) : {} > IPC_VRING_MEM
    }
    
    MEMORY
    {
        M4F_VECS : ORIGIN = 0x00000000 , LENGTH = 0x00000200
        M4F_IRAM : ORIGIN = 0x00000200 , LENGTH = 0x0002FE00
        M4F_DRAM : ORIGIN = 0x00030000 , LENGTH = 0x00010000
    
        /* shared memories that are used by all cores */
        /* On M4F,
         * - By default MSMC RAM is not accessible to M4F, a RAT entry is needed to make it
         *   accessible on M4F
         * - So make sure there is a RAT entry which has a 1:1 mapping from 0x70000000 to 0x70200000
         */
        USER_SHM_MEM            : ORIGIN = 0x701D0000, LENGTH = 0x00010000
        //LOG_SHM_MEM  : ORIGIN = 0x701D0000 + 0x180, LENGTH = 0x00004000 - 0x180
        //IPC_VRING_MEM: ORIGIN = 0x701D4000, LENGTH = 0x0000C000
    }
    

    MPU and RAT:

    * ----------- AddrTranslateP ----------- */
    #define CONFIG_ADDR_TRANSLATE_RAT_BASE_ADDR  (0x044200000u)
    #define CONFIG_ADDR_TRANSLATE_REGIONS  (5u)
    
    AddrTranslateP_RegionConfig gAddrTranslateRegionConfig[CONFIG_ADDR_TRANSLATE_REGIONS] = 
    {
        {
            .localAddr = 0x80000000u,
            .systemAddr = 0x0u,
            .size = AddrTranslateP_RegionSize_512M,
        },
        {
            .localAddr = 0xA0000000u,
            .systemAddr = 0x20000000u,
            .size = AddrTranslateP_RegionSize_512M,
        },
        {
            .localAddr = 0xC0000000u,
            .systemAddr = 0x40000000u,
            .size = AddrTranslateP_RegionSize_512M,
        },
        {
            .localAddr = 0x60000000u,
            .systemAddr = 0x60000000u,
            .size = AddrTranslateP_RegionSize_256M,
        },
        {
            .localAddr = 0x70000000u,
            .systemAddr = 0x70000000u,
            .size = AddrTranslateP_RegionSize_256M,
        },
    };
    
    #define RODATA_CFG_SECTION __attribute__((section(".rodata.cfg")))
    
    /* ----------- MpuP_armv7 ----------- */
    #define CONFIG_MPU_NUM_REGIONS  (3u)
    
    const MpuP_Config gMpuConfig RODATA_CFG_SECTION = {
        .numRegions = CONFIG_MPU_NUM_REGIONS,
        .enableBackgroundRegion = 0,
        .enableMpu = 1,
    };
    
    const MpuP_RegionConfig gMpuRegionConfig[CONFIG_MPU_NUM_REGIONS] RODATA_CFG_SECTION =
    {
        {
            .baseAddr = 0x0u,
            .size = MpuP_RegionSize_4G,
            .attrs = {
                .isEnable = 1,
                .isCacheable = 0,
                .isBufferable = 0,
                .isSharable = 1,
                .isExecuteNever = 1,
                .tex = 0,
                .accessPerm = MpuP_AP_ALL_RW,
                .subregionDisableMask = 0x0u
            },
        },
        {
            .baseAddr = 0x0u,
            .size = MpuP_RegionSize_256K,
            .attrs = {
                .isEnable = 1,
                .isCacheable = 1,
                .isBufferable = 1,
                .isSharable = 0,
                .isExecuteNever = 0,
                .tex = 1,
                .accessPerm = MpuP_AP_ALL_RW,
                .subregionDisableMask = 0x0u
            },
        },
        {
            .baseAddr = 0x701D0000u,
            .size = MpuP_RegionSize_64K,
            .attrs = {
                .isEnable = 1,
                .isCacheable = 0,
                .isBufferable = 0,
                .isSharable = 1,
                .isExecuteNever = 1,
                .tex = 1,
                .accessPerm = MpuP_AP_ALL_RW,
                .subregionDisableMask = 0x0u
            },
        },
    };

  • Tron,

    Are you able to run the code line by line in debug mode? Can you check the instruction and value which is causing the crash?

  • Hi Sudeshna. Yes, I can:

    The hard fault of the M4 core occurs as soon as the vTaskScheduler() function is called by main(), which I can confirm by stepping through the code. Strangely, a chunk of DebugP_log lines from code yet to be executed is instantly written to the CIO, much faster than the other cores are able to when actually running the code that produces it.

    See also this quote:

    EDIT: If I add this junk code at line 533 of the file, then it also doesn't hard fault. It seems as though the M4 code is sensitive to whatever instruction happens to be in this exact place in memory.

    From here I've learned that if I change any values of the global shared memory variables being initialised by this file, or if I add/remove any lines, then there's a chance the M4 core will hard fault. The way to stop the hard fault as a temporary fix is to add lines of code that don't do anything, even something as simple as this, and trying different placements until it works - like a game of pin the tail on the donkey:

    i;

  • Tron,

    What do you intent to achieve with first 3 RAT config you have?

    There can be multiple reason for this. Can you try to step into the vTaskScheduler() and see if you figure out which statement / assembly line is leading to corruption.

    You can also try using the trace dump and analyzing the same, please refer https://www.youtube.com/watch?v=PXMvAnzA7Vs

    Regards,

    Ankur

  • Hi Ankur. The first 3 RAT entries were there by default as a part of the empty multi-core project. If I recall correctly, we added the fourth when we configured the M4 core to access the same shared memory region as we did with the other R5 cores.

    I've stepped through the scheduler function a few times now. If I'm not careful and I step over some mundane functions, the execution will just continue and hard fault. If I go step by atomic step (it takes a long long time) it will eventually do the same but I can get further, and it seems to happen at different and unrelated points.

    I'll look into the trace dump soon - thanks for showing me this. I'll let you know what I find there.

  • You can also try using the trace dump and analyzing the same, please refer https://www.youtube.com/watch?v=PXMvAnzA7Vs

    I thought I'd return to this because the problem is currently unavoidable using previously discovered workarounds.

    We cannot run a trace dump successfully.

    When we can get CCS to dump a trace from the beginning of execution, the buffer overfills by the time it gets to the important part. If we use a circular buffer, the crash loop quickly overwrites the useful data we want to see. If we set a start and stop address we either:

    1. capture no data somehow, while still executing past the start address and seeing the console output happen from it before hard faulting, or

    2. we can't get the Core Trace to start, getting an error message, "Failed to fill CPU info from Channel server", with an additional "address label" text box appearing that can't be removed, before eventually all of CCS hangs and we need to manually end the process from the Task Manager and restart.

  • I managed to get Core Trace to run. I have to step through the execution until the moment I want to start recording, and only then can I open Core Trace and use the default settings if I want it to record.

    The problem from here is similar to an earlier issue, though: when I record the trace, the hard fault doesn't happen. This is the same as earlier when if I stepped through the IPC message hard fault issue manually there would be no hard fault there either.

    Interestingly enough, this hard fault is currently happening at the IpcNotify_SyncAll() function call at the beginning of the main task which we've been using to sync out shared memory initialization. I'm unsure if it's the same M4F hard fault issue at boot we've also been discussing - particularly as no number of additional no-op code (usually one or more lines of "i;" that do nothing) is making it go away like we can do with the other fault - but I am beginning to suspect that they are more related than anticipated.