This thread has been locked.

If you have a related question, please click the "Ask a related question" button in the top right corner. The newly created question will be automatically linked to this question.

TM4C123GH6PM: CCS Theia debug breakpoints do not work

Part Number: TM4C123GH6PM
Other Parts Discussed in Thread: EK-TM4C123GXL,

Tool/software:

Greetings, 

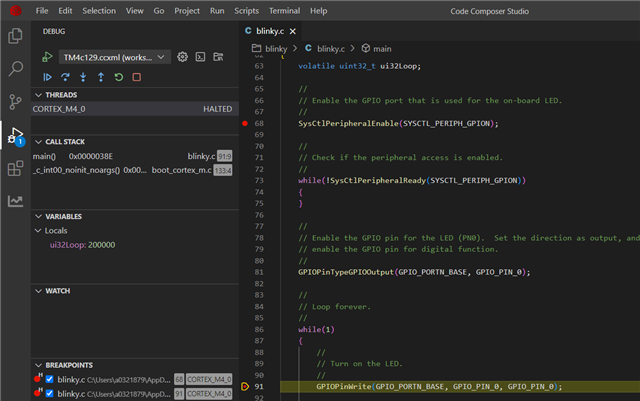
I recently installed the latest version of CCS Theia. This is my first time using the VS Code-based version of CCS, and I have a problem with debugging. I built the example program "hello" for the EK-TM4C123GXL board and it seems to run fine, however when I launch a debug session and try to enable a breakpoint somewhere in hello.c, it doesn't work, and I get the message "No code is associated with (project directory), line xxx in any loaded symbols". I tried enabling a breakpoint in the file boot_cortex_m.c, which had the same result. I am using the Debug configuration for the project.

Potentially useful info:

I'm using an EK-TM4C123GXL (with the main uC removed and the JTAG lines broken out) as the debugger/programmer.

When I click on "debug" at the bottom of the Project Properties window, I get the message "Cannot read properties of undefined (reading 'name')" whether I'm running the debug session at the time or not.

When the debug session is started, in the CALL STACK panel, I see a reference to the boot_cortex_m.c file. However, the directory for this file is defaulted to one that begins with 'E:\cvs\jenkins\workspace\.....' until I change it manually. This doesn't fix the problem, however. I don't know what this is. On my PC, the E:\ drive is the DVD drive, which is empty! Nothing is installed there.

Any help would be appreciated! Thank you.

  • Hi,

    I launch a debug session and try to enable a breakpoint somewhere in hello.c, it doesn't work, and I get the message "No code is associated with (project directory), line xxx in any loaded symbols".

    How did you load the original hello image? Did you load the hello.out? If you load the hello.out then it contains the symbols for debug. However, if you load the hello.bin file then there is no symbols in it. Or if you have power off the board and reconnect to the target again wanting to continue debug then you will need to reaload the symbols by going to th Run->Load->Load Symbols.... and select the hell.out file. This is only loading the symbols, not reloading the program image. Once the symbols are loaded then you can place breakpoints on the left side of the line number of your program. See below example where a red dot is placed if you place a breakpoint here. 

    When I click on "debug" at the bottom of the Project Properties window, I get the message "Cannot read properties of undefined (reading 'name')" whether I'm running the debug session at the time or not.

    On the left side under theTHREADS, do you see the CORTEX_M4_0 is DISCONNECTED or HALTED or RUNNING? If it is DISCONNECTED, then it means the debugger is not connected to the target yet. You need to right-click on the processor and connect the target. If you are successfully connected to the target then the status should first change to HALTED. If you have not load your program this is the time to load your hello.out or reload the symbols if you already have the binary loaded to the flash previously. If you run the program then the status will change to RUNNING. 

  • Thank you for the reply.

    How did you load the original hello image? Did you load the hello.out?

    When I click "Debug Project" or "Start Debugging", it loads the program automatically. I assume it would load hello.out, if this is what contains the debug symbols.

    Once the symbols are loaded then you can place breakpoints on the left side of the line number of your program.

    With the debug session paused, I selected Run -> Load -> Load Symbols, then selected "hello.out" from the Debug folder. The problem remains. I tried the same using Add Symbols instead of Load Symbols. I get this message in Debug Output: 


    Breakpoint Manager: One or more breakpoints will not relocate to new symbolic locations until the target halts.

    So, I paused the target, started it again, and the problem remained.

    On the left side under theTHREADS, do you see the CORTEX_M4_0 is DISCONNECTED or HALTED or RUNNING?

    When I start the debugging session, HALTED is displayed on the right besides CORTEX_M4_0. I am able to start program running using the "Continue" arrow, and I can stop the program by pressing the "Pause" button. I can see the blue LED flashing on my board when the program is running, and it stops when I click "Pause".

    Something else that might be relevant: when I first created this project, it would not compile at all. First, it said something like "the project was created using a compiler that has not been installed". I had to change the compiler from "v17.12.2.lts" to "TI Clang v4.0.3.LTS". Next, it couldn't find any of the library files. I had to manually edit the variable called "COM_TI_TM4C_INCLUDE_PATH" to point it to the Tivaware_C_Series folder. Only after that would it compile, but with several warnings about a mismatch of the data type wchar between the compiled program and the library object files. All in all, it seems that it is not working "out of the box" as it is supposed to.

    Thank you

  • Hi Thomas,


       For Tiva processor, please use TI Arm compiler. CCS20 by default does not install TI Arm compiler but only Clang. To install the latest TI Arm compiler, please download from https://www.ti.com/tool/ARM-CGT. Once you download and install, make sure CCS20 will automatically detect the path to the installation location by going to the setting. See below image at the lower left setting icon and update the discovery path. You can also watch this CCS20 video training. https://www.youtube.com/watch?v=1jkpPGcbxxA. Having said that, if you are used to the Eclipse-based CCS12 or prior versions and no strong desire to incur some learning curve on the Theia-based CCS20 then I will suggest you stay with the CCS12 version. For myself, I'm still using CCS12 for my daily work. I can guarantee if you use CCS12 every example will be running without modification out of box. You can download the latest Eclipse-based CCS12.8 from https://www.ti.com/tool/download/CCSTUDIO/12.8.1. By all means, you can use CCS20 if you want to. It is just that you need to make CCS20 detect the TI Arm compiler path. The TivaWare library was not build for Clang and yes, you will encounter those errors/warnings. This is the reason please only use TI-Arm compiler for out of box experience. 

  • That makes sense. I will try installing the correct compiler, then come back to mark the issue as resolved. It is confusing because in Resource Explorer, if EK-TM4C123GXL or TM4C123GH6PM is selected as the device, no results are found unless the Compiler filter is selected as "CSS - TI Arm Clang Compiler".

    If I choose to switch back to an Eclipse-based CCS, will it still be supported? I thought only the latest version was supported.

  • Hi Thomas,

      Yes, CCS12 is fully supported.