This thread has been locked.
If you have a related question, please click the "Ask a related question" button in the top right corner. The newly created question will be automatically linked to this question.
Hi,
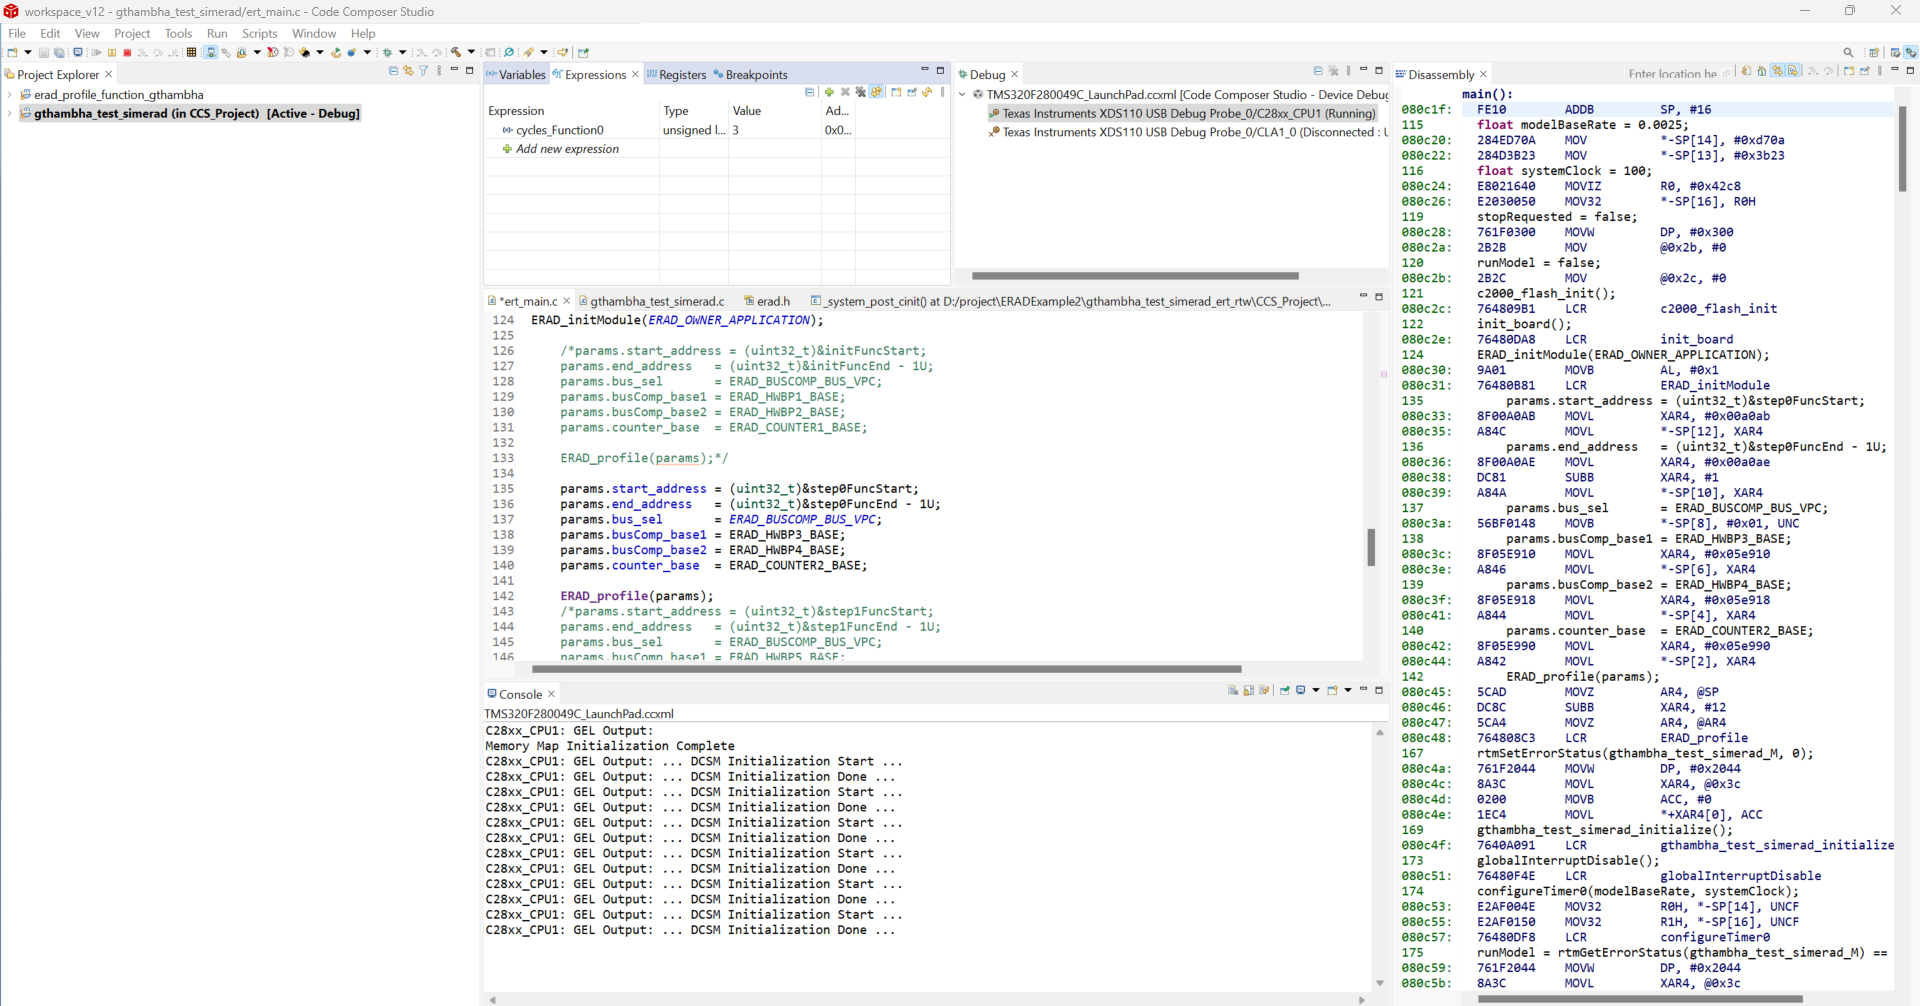
I have generated code from this Simulink model (https://www.mathworks.com/help/ti-c2000/ug/real-time-profiling.html), and I am including erad.h in CCS in order to profile 4 functions. In one particular function, the ERAD counter reads 3 cycles, as can be seen in the following image:
On placing breakpoints within the function and checking the Count Event breakpoint, the count comes out to be 74 cycles:
On introducing a delay using Sysctl_delay, a similar disparity in reading can be seen. On increasing the delay, the Count Event value does not change.
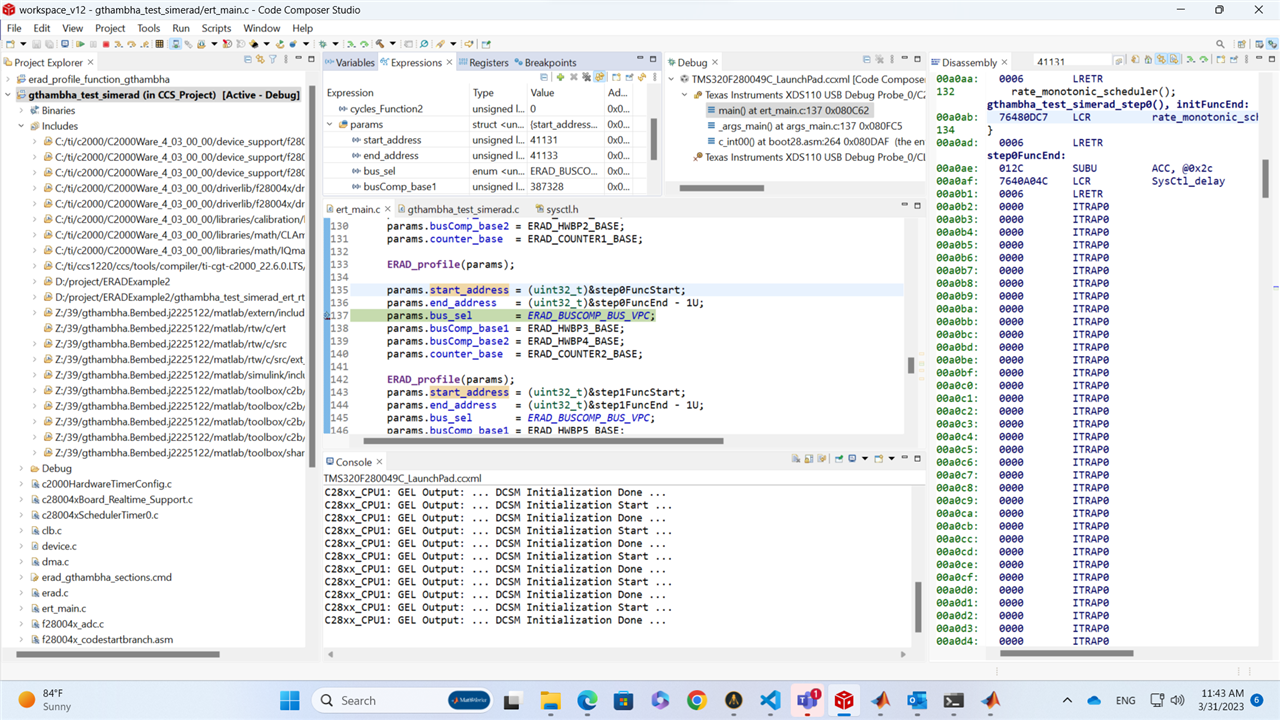
The initialization for ERAD is as follows:
We considered the possibility of there being an address mismatch, but the addresses are also in order:
This disparity can be seen only in the case of this function, for all the other functions the ERAD profile count is in the same range. It would be really helpful if someone could provide more insights on this.
Thanks in Advance
Ganesh
Hello Ganesh,
Apologies for the delayed response. Each ERAD profile setup takes up 2 bus comparator (EBC) units and 1 system event counter (SEC) unit. If you are setting up 4 profiles at once, then you are attempting to use all of the ERAD resources available on the device. I suspect that Code Composer is also trying to use one of the bus comparator units to set hardware breakpoints, and so there are not enough resources available to profile all four functions.
Best regards,
Ibukun
Hi Ibukun,
I tried to check the count by setting up ERAD only for the particular Step function. No breakpoints were setup using CCS. The issue still persists:
The number of cycles value is still 3. The contents of this function are as follows:
Ganesh,
Apologies for the delayed response on this. I am attempting to replicate this issue on my end and will revert as soon as I have an update.
Best regards,
Ibukun
Ganesh,
Could you show me the following:
- The assembly output of the gthambha_test_simerad_step0 function
- The linker command file defining the addresses
- The linker map file showing the placement of this function in memory
Alternately, if you could send me a zip file with the code over DM, that would be helpful.
Thanks,
Ibukun
Ganesh,
I still have not been able to replicate this issue. One thing I have been thinking about is whether the fact that this is effectively a one-liner function (LCR call, LRETR), combined with some kind of pipeline discontinuity, is causing ERAD to terminate its count prematurely. If you inserted NOPs manually into the step function after the call, does it still return 3 cycles?
Also, are you running from RAM or Flash?
FWIW, when I tried to create a similar situation, the computed count was correct. So this is shooting in the dark, but perhaps there is another artifact of your situation that makes it behave differently (e.g. running from Flash rather than RAM).
Best regards,
Ibukun
Hi Ibukun,
On inserting NOP manually, I am getting the correct computed count. Does this indicate a premature ERAD termination in the case of a one liner function and/or combined with a pipeline discontinuity?
Regards,
Ganesh
Yes, that is my best theory of what is happening at the moment. The ERAD operates by intercepting addresses on the bus, so in the case of an extremely short function, it is possible that the normal read-ahead combined with a pipeline discontinuity caused a premature match on the bus comparator. I do plan to follow up with our design team on this theory.