Hi,
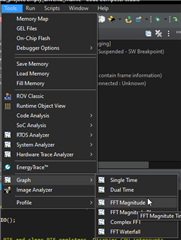
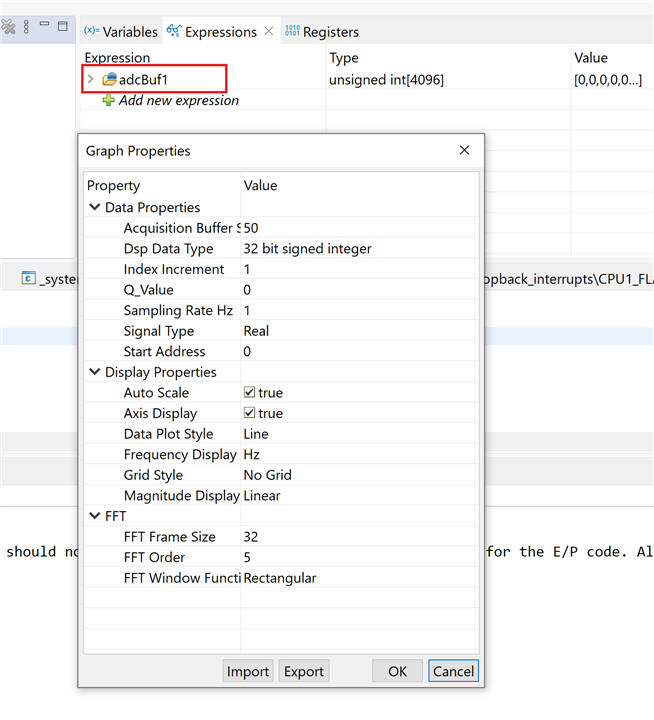
How can I plot FFT of a variable or watch expression? When I right click on any expression i have only one option to graph, in time domain. From tools it plot empty graphs.
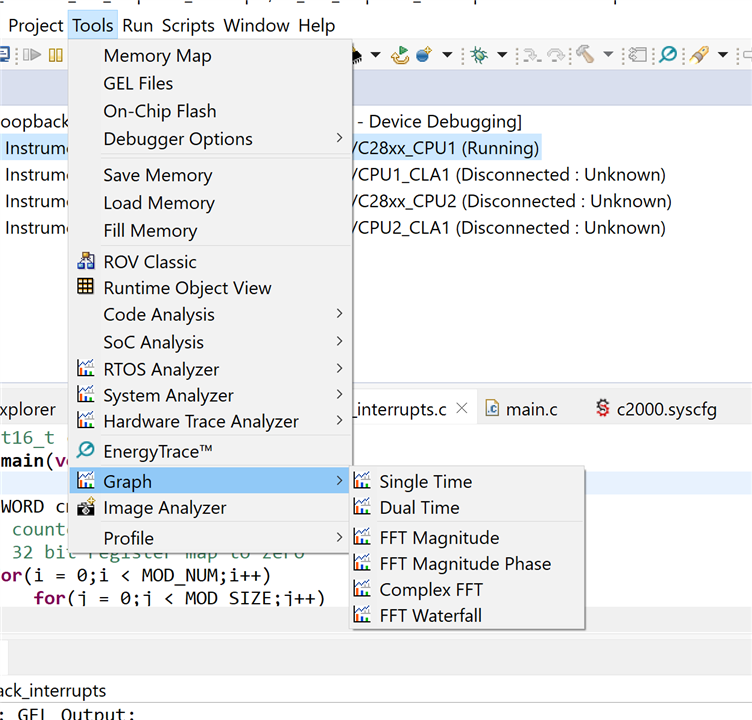
How do i select expression to plot from tools menu?
thanks vadim
Hi,
How can I plot FFT of a variable or watch expression? When I right click on any expression i have only one option to graph, in time domain. From tools it plot empty graphs.
How do i select expression to plot from tools menu?
thanks vadim