Hi,
I'm exploring the HVACI_Scalar project in the "C:\TI\controlSUITE\development_kits\HVMotorCtrl+PfcKit_v1.6\HVACI_Scalar"
I run the exact original project shipped with controlSuite on the TMX320F28035 ControlCard. Following the documentation, I use the graph and DLOG utilities to view the data of Ta,Tb,Tc and Ta-Tb generated by SVGEN module.
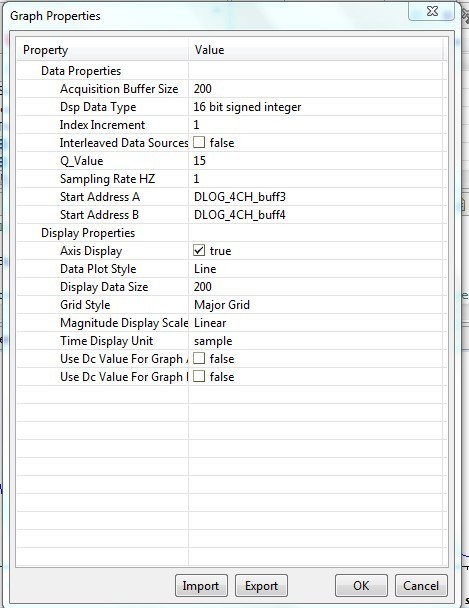
The base frequency is 120Hz.If I set the SpeedRef=_IQ(0.3), everything is fine. but if I set the SpeedRef=_IQ(0.4) or higher, say _IQ(0.5), than the sinusoidal curve of Tb-Tc will broke. my Graph setting is like this:
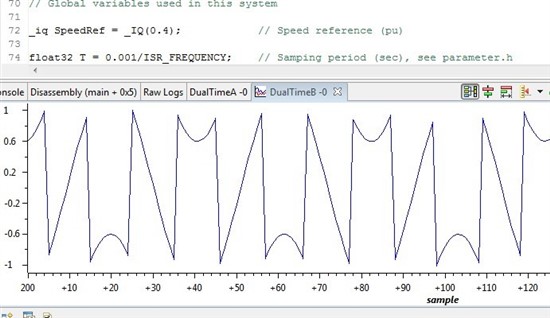
And the Curve of Tb-Tc when SpeedRef=_IQ(0.4) is like this:
I'm not so clear about the meaning of Tb-Tc. my question is, if I run the programme with SpeedRef=_IQ(0.4), or 48Hz, in the physical platform, what does the the line-to-line voltage look like? Same as the Tb-Tc in the graph? or will it damage the hardware? or the physical voltage curve will become saturated?
Your prompt help is greatly appreciated.
George


