This thread has been locked.
If you have a related question, please click the "Ask a related question" button in the top right corner. The newly created question will be automatically linked to this question.
Hello,
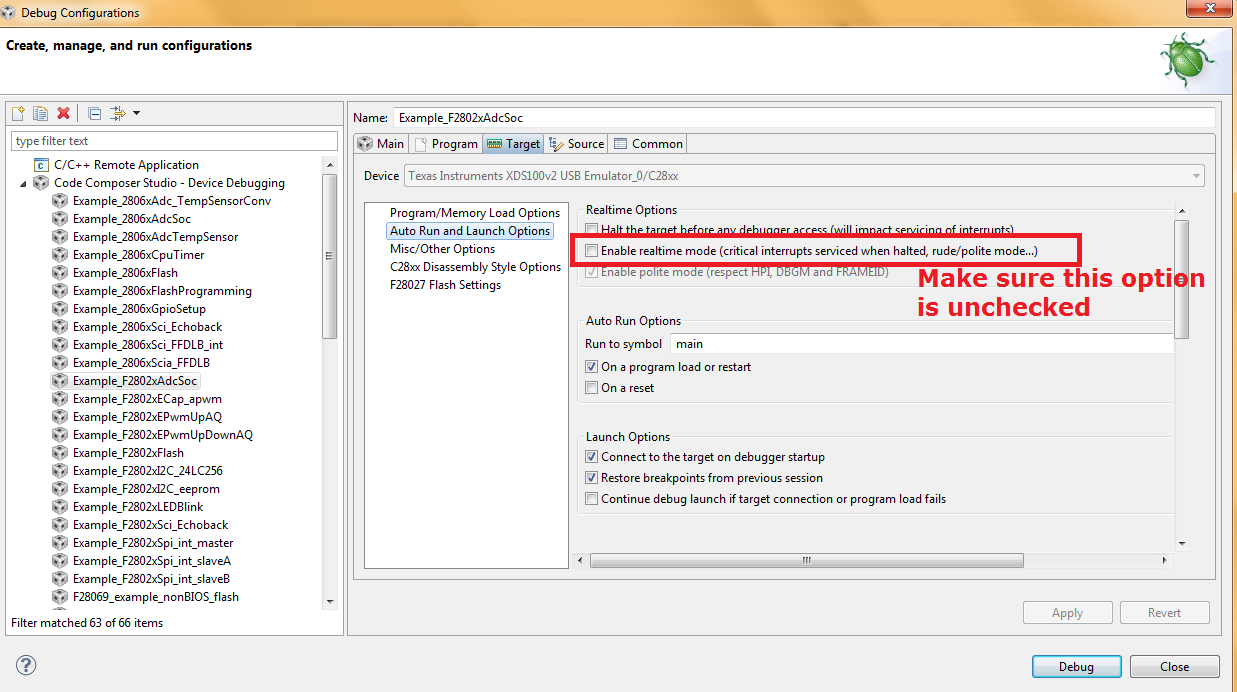
I am creating new project. And after compiling, loading and running code in debug mode the error message " Device blocked debug access because it is currently executing non-debuggable code " is appeared on the screen. This is the problem I faced mostly when new project is created. What can be the problem?
These are the some settings of CCS projects.
- device support / f2802x / v125/ DSP282x_Common / Cmd / F28027.cmd file is used.
- device support / f2802x / v125/ DSP282x_Heades / Cmd / DSP2802x_Headers_nonBIOS.Cmd is used
interrupt settings are
EALLOW; // This is needed to write to EALLOW protected registers
PieVectTable.TINT0 = &MainISR;
EDIS; // This is needed to disable write to EALLOW protected registers
// Enable PIE group 1 interrupt 7 for TINT0
PieCtrlRegs.PIEIER1.all = M_INT7;
// Enable CPU INT1 for TINT0:
IER |= M_INT1;
// Enable Global realtime interrupt DBGM
include options are
"C:\ti\controlSUITE\device_support\f2802x\v125\DSP2802x_common\include"
"C:\ti\controlSUITE\device_support\f2802x\v125\DSP2802x_headers\include"
"C:\ti\controlSUITE\development_kits\~SupportFiles\F2802x_headers"
"C:\ti\controlSUITE\libs\app_libs\motor_control\drivers\f2802x_v2.0"
"C:\ti\controlSUITE\libs\app_libs\motor_control\math_blocks\v4.2"
"C:\ti\controlSUITE\libs\math\IQmath\v15c"
Device is f28027 piccolo micro and system clock is 60Mhz.
Hi Rasit,
This error has to do with realtime access to the processor. The processor can block realtime - if you select "rude retry" then it will let the accesses from Code Composer take place.
For more information on realtime through CCS please see:
http://processors.wiki.ti.com/index.php/Real-Time_Mode_Debug_with_CCStudio
Also, I would like you to include "F2802x_GlobalVariableDefs.c" file to your project, that can be found here:
C:\ti\controlSUITE\development_kits\C2000_LaunchPad\f2802x_headers\source
Refer the docs available here:
C:\ti\controlSUITE\device_support\f2802x\v210\doc
Regards,
Gautam
Hello Rasit,
Is there any SCI setting (GPIO28 and GPIO29) on your project (maybe by default they set as SCI)?
I also faced that error message when there was contention between GPIO28 and GPIO29 as SCI and with UART that used by the debugger/PC (actually this is contention from the board).
What board that you use for F28027? Also is it onboard XDS100 that you use for debugging?
If you use Launchpad-F28027, there is switch S4 to resolve this problem:
If your problem is considered from something else, please give us more detail that maybe we can help.
Best regards,
Maria
Dear Maria ,
I am using card designed by me. I also check GPIO28-GPIO29 pins they are set as SCI RX-TX pins in software but I am not using SCI comm. and in the card hardware these pins are not connected somewhere.
By the way I am triying to solve problem. Very interesting things happens. I import the project in the adress
device support/ f2802x / V210 / f2802x_examples / adc_soc
I compile, load and run the adc_soc program using the same hardware. Error message "Device blocked debug access because it is currently executing non-debuggable code" is not seen. I checked ADC register everything seems OK. Real time mode works as expected. ADC register refresh occurs in watch window.
Then I try to reference this project to solve problem. Before this I again compile, load and run my project then I didint see any problem. Error message is not seen. I didint make any changes in the software and hardware. Just I import and load -run adc_soc project then I switched to my project.
I decided that If I can run the project I can work on with the same set up. But in that case after turning off and on again micro supply and again load -run the my project with same set up problem occured again.
OK, thanks for explaining your case more detail.
Btw, did you call CPU_enableDebugInt() (for clearing DBGM bit in ST1) in your code?
If not, please call this function CPU_enableDebugInt().
You can find the explanation in this thread:
http://e2e.ti.com/support/development_tools/code_composer_studio/f/81/p/51390/182664.aspx#182664
Best regards,
Maria
Hi Maria,
I am using CCSV5. In debug options menu only " Enable polite mode" available and its checked. There is no option (as I see) Enable real time mode icon. I tried to paste "CPU_enableDebugInt()" function to my code. Some errors and warnings is appeared in console. I tried but I couldnt add this function.
On the other hand I still work on with adc_soc project example. In this project I see that watchdog is disabled before device calibration on line 76 with function WDOG_disable(myWDog);
if this function is commented the same error that is Device blocked debug access because it is currently executing non-debuggable code is appeared. So problem can be related with disabling Watchdog before device calibrating.
I also paste this function WDOG_disable(myWDog); to my code some errors like cpu.h and wdt.h cant open. I triying to fix problems so that I can see what will happen while disabling watchdog before device calibration.
OK, let us know the result.
The picture that I showed you before was from CCSv5.4.
What version of CCSv5 are you using? Because in CCSv5.5, this option is also available.
Btw, for replacing CPU_enableDebugInt(), you can use:
asm(" clrc DBGM");
Best regards,
Maria
Hi Maria,
Problem is solved by defining flash in compiler settings. This condition may be specific to my code.
Thanks ,