- Ask a related questionWhat is a related question?A related question is a question created from another question. When the related question is created, it will be automatically linked to the original question.
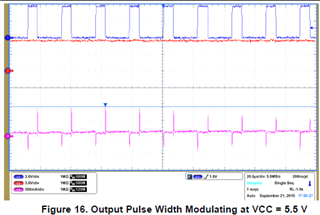
In the datasheet of DRV8830 there are some graphs of the motor current when using internal PWM to reduce the average voltage of the motor to 4V. The graph in question is Figure 16, paragraph 8.2.3 Application Curves.
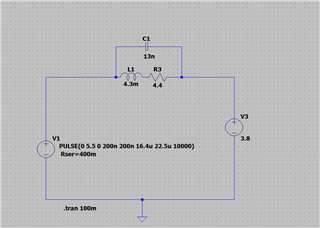
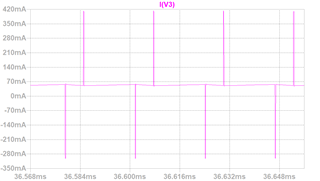
How can it be so big and and so short spikes in the motor current (booth positive and negative spikes)? I thought the inductance in the motor should make the current curve looks more like a triangular shape and always positive? Is there any simple (LT-)SPICE model for a running motor together with an ideal voltage source generating a PWM-signal to simulate this graph?