Other Parts Discussed in Thread: BQSTUDIO, GPCCHEM, GPCRB
Good day TI experts.
I have conducted a test to determine the uncertainty of the fuel gauge when is intended to detect the EOS of a battery pack. This test I was conducting was developed and discussed on an older post: https://e2e.ti.com/support/power-management-group/power-management/f/power-management-forum/1003738/bq35100-eos-impedance-measurements-with-wrong-results/3722064?tisearch=e2e-sitesearch&keymatch=%20user%3A484197#3722064
On the last test, I got the following results:
- SOH was always dropping at the same rate. Basically, I never got an accurate value from it. I charged the right chemistry ID from an LS 14500 Saft cell. Basically, every cycle would drop as much % I set on SOH max delta%.
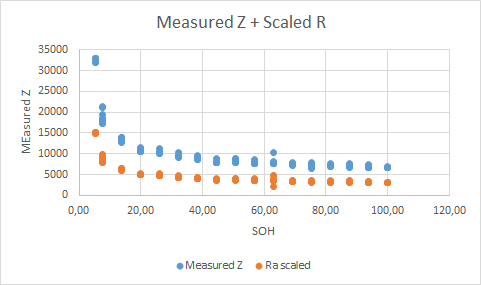
- At the beginning all the measurements were more or less coherent to the Ra table, but after the EOS trend detection count reached the threshold, the EOS warning was given and the measurements were completely odd.
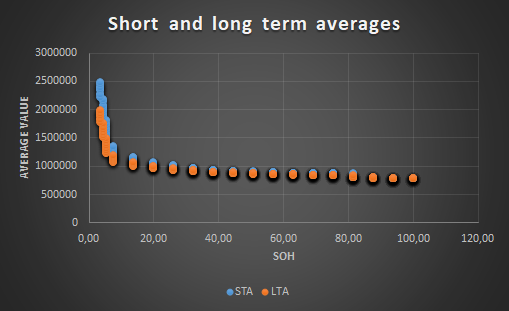
- Also another odd result, the short and long-term averages were already separated enough to give the EOS flag way early in the experiment.
- The flag SOH_MERIT was almost all the time present. I could never get rid of it.
As you may see, the experiment results were not good.
We would like to conduct another experiment, but this time, we would like to know what we did wrong on the previous one. Our setting was simple: The evaluation board had some resistors as a load, gauging 2 cells of 3.6V (Saft LS14500).
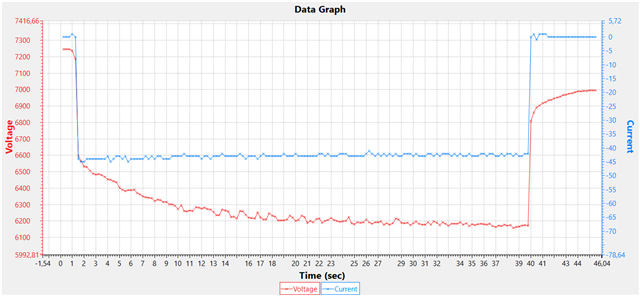
We were using as a learning pulse, a deep discharge of 45mA for 2 minutes. The measurements were taken every 5 hours with sometimes a rest of 10 hours. After every 5 measurements, we provided a deep discharge for 2 hours to reduce the battery capacity and observe more closely, when the battery impedance starts changing.
In addition, there are some elements that were not clear for us about BQ35100:
1) What are the Long and short-term filters? There are not specified on any TI document, but those seem to be related to the calculation of the Long and short-term average. Where is this applied? can we modify those parameters? do they have to be tuned for better performance?
2) Can the impedance measurement affected by changing something on the DF? During the experiment, I was learning how to read raw data from the gauge, and suddenly the device started to behave oddly and was giving lower values of impedance as before (the battery was supposed to have just 20% of the charge).
3) How many measurements should be taken to obtain reliable values for long and short-term averages?
4) What are the appropriated values for EOS trend detection % and Thrshld?
5) How long should be the pulse and how deep should be the discharge for this pulse? I was using a 2 min long learning pulse that drops the battery around 500mV.
6) How is the impedance calculated? I would like to know how this is done because I would like to compare the obtained measurements with my own calculations.
7) How is the OCV value measured?
8) What is the role of OCV on the impedance calculation?
9) Could be possible that the "SOH_MERIT" error could be affecting my measurements?
10) How can I make the SOH more accurate? I have read that if I provide my own Ra table, this would be more adjusted to how the battery on my system behaves. (On this post: BQ35100: Using the BQ35100 in EOS (questions about unsealed access, Ra table, SOH, R Data Seconds) - Power management forum - Power management - TI E2E support forums )
If you need more detail please let me know so I can provide them to you.