This thread has been locked.
If you have a related question, please click the "Ask a related question" button in the top right corner. The newly created question will be automatically linked to this question.
Hi expert,
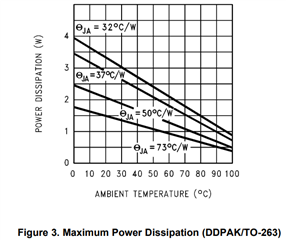
There ae 4 curves in datasheet Figure.3, customer should use which one when evaluate thermal performance of LM340-15/NOPB?
Regards,
Jared
Hi Jared,
This graph shows the Power Dissipation with different Rja values. This is to give an idea of how much the device will dissipate depending on your application.
Rja is affected by PCB layout and cooper. Section 10 of the Data Sheet talks more about this. In addition, you can also refer to our Application Note: "An empirical analysis of the impact of board layout on LDO thermal performance" that goes more in detail.
So, depending on your board and how much Rja you have, then Figure 3 will provide an idea of how it applies to your application.
Best,
Edgar Acosta