This thread has been locked.

If you have a related question, please click the "Ask a related question" button in the top right corner. The newly created question will be automatically linked to this question.

BQ25616: Li Charger + Power Path control design peer review and questions

Part Number: BQ25616

The BQ25616 circuit shown at the top of this post in original question has been transferred to a PCB and while testing questions have arisen. The STATUS LED is flashing indicating a fault condition however it is not apparent which fault is occurring.

A Li battery discharged to a level of ~3.1 VDC is connected to J2. A resistor sized to draw 5 mA simulating load of device to be powered is connected to J1. J3 charger input connects to a power supply set to 5 VDC @ 2 A.

With charger input power supply off BQ25616 routes battery voltage to load. With charger input power supply on the following conditions are observed.

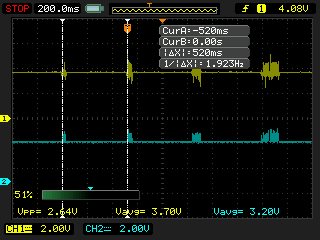
U1 pin 24 has 4.88 VDC. J1/load voltage 3.7 VDC. Battery positive terminal voltage 3.2 VDC. STATUS LED is flashing on/off. Current meter in line with battery positive wire shows cycling between battery supplying +5 mA to load and receiving bursts of -100 to -200 mA of charge current. The attached ‘scope capture of load voltage (yellow top trace) and battery voltage (blue lower trace) show voltage bursts that are sourcing the charge currents observed, this cycles at ~520 mS rate.

With the battery voltage at 3.2 VDC referring to data sheet’s ‘Figure 11. Battery Charging Profile’ one theory is the circuit is in the Pre-charge range on the threshold of Fast Charge and Voltage Regulation range. However the datasheet does not mention flashing status LED for such a state. Rather “status: charging (LOW), charging complete or charge disable (HIGH) or charging fault (blinking).” Reviewing section ‘9.3.9 Protections’ on data sheet it is not apparent which fault is being detected. Hints as to what I am missing?

  • Note - See original post for circuit schematic.

  • Hi, at 3.2V, the charger should do fast charging. What is the battery size, do you have long wires from BAT pin to your battery that may cause oscillation due to the impedance. You may try to add a electrolyte cap on BAT and see if the problem is gone. Besides, increases the battery voltage above 3.08V and see if you see the oscillation. For scope waveforms, you may monitor STAT point as well for next time.

  • Thanks to Hong Mao for the quick response.

    You asked & suggested:

    Battery size? – The primary target cell is SAFT’s MP 176065 5.6Ah with a 4.2V charge voltage at current max = 5.6A. For the 176065 ICHG R set to 274 for max charge I of 2.47 A.

    https://www.saftbatteries.com/products-solutions/products/mp-small-vl

    A secondary cell is the ULTRALIFE UBBL19-C1 specified 2.4Ah here a 4.2V charge voltage at current max = 466 mA. For the UBBL19 ICHG R changed to 1.54k reducing max charge I to 429 mA.

    https://www.ultralifecorporation.com/ECommerce/product/ubbl19/li-ion-rechargeable-1s1p-battery/ubbl19-c1/1s1p-18650-24ah-conn

    Wire length? – 12.5 cm on the 176065, 17.5 cm on UBBL19. While testing these are extended for tasks like measuring current to/from cell.

    Try to add electrolyte cap on BAT – Added 100 uF 10v Panasonic FC to the UBBL19, retested with no apparent effect. This was added at battery connector, would it be better to add cap onto PCB closer to C2?

    Besides, increases the battery voltage above 3.08V and see if you see the oscillation. – With the UBBL19 connected I allowed circuit to run charging the cell with STATUS flashing. A FLUKE 289 measuring current to/from the cell in its max/average/min recording mode reported up to 200 mA of peak charge into the cell but only 10s mA average charge current due to the low duty cycle. As this slowly brought the battery voltage up the STATUS LED on/off flashing duty cycle changed with the light on = charging without fault time growing longer and longer.

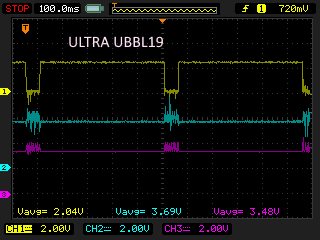
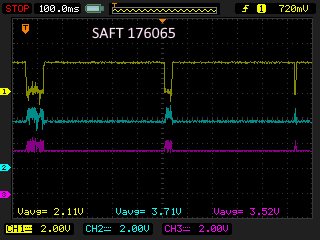
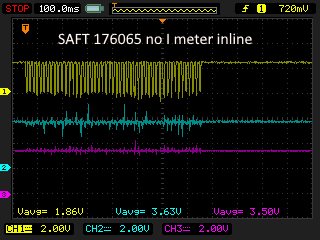
    For scope waveforms, you may monitor STAT point as well for next time. - Ok, see below a capture of each cell with STAT node top trace, then output voltage, and cell voltage on the bottom. Reading what I wrote above about the meter in line with the battery and recalling how often the resistance of a meter’s current shunt causes mischief I repeated the scope capture minus the meter with 176065 pack’s connector plugged directly into the PCB’s connector. This does change the duty cycle of the STATUS oscillations.

  • Moved 100 uF 10v Panasonic FC 'lytic cap from battery cell cable to in parallel with C2 on PCB. No effect on STATUS oscillations.

  • Can you please label CH1, CH2 and CH3? CH1 is STAT? What about CH2 and CH3? Please elaborate the test conditions for each waveform you attached. Eletronyte cap should be connected close to the charger's BAT. 12.5 cm wire is long, what is the thickness of the wire?

  • Hello Mao, apologies for going quiet; I took a week off and actually managed not to check-in on work tasks.

    In the above ‘scope captures:

    CH 1 (yellow) BQ25616 STST pin

    CH2 (blue) output voltage BQ25616 SW node after LC filter

    CH3 (violet) cell voltage BQ25616 BAT node ahead of 10 uF cap and 4 amp fuse

    For each of the screen shots 5 VDC is applied to BQ25616 VBUS node, battery is connected to BAT, and a light 5k ohm load placed on SW node after LC filter simulating the fraction of a mA load the device to be powered places on the circuit.

    I find your comment “12.5 cm wire is long, what is the thickness of the wire” interesting. That pack is specified to use “20 AWG TEFLON STRANDED CU WIRE”. In the actual pack being charged these are 10cm/4in long, I added the extra 2.5 cm of length to account for adapter and clip leads used for these tests on my bench. For a replaceable battery pack in an industrial device 10 to 15 cm of wire on the pack’s lead seems typical. On the BQ25616 are the feedback loops into pins BTST and SYS prone to stability issues?

    I am in the process of building a battery simulator so that investigations at various batter voltages can be carried out.

  • Hi NORMAN:

    One thing to confirm, "CH 1 (yellow) BQ25616 STST pin", did you mean BTST pin? BEST is very sensitive to noise. It would be great if you could provide SW and STAT waveforms.

    Regards,

    Hong

  • No, the typo is yellow trace is STAT the pin 5 status signal. It's flashing the LED showing a fault instead of staying on for charge or off for charging completed or sleep is the issue being pursued.

  • Hi Norman:

    From the STAT waveform, the duty cycle is not 50% which means it is not the defined charge faults in the datasheet. LED flashing on STAT pin means the charger oscillate between charge and no charge. I suggest remove current meter FLUKE 289 between charger's BAT pin and battery and shorten the wire connection. The current meter impedance could be high. Besides, try adding higher capacitance (>10000uF) close to the charger. Besides, to find the root cause, you may try these: 1. Remove loading on SYS. 2. reduce charge current to  200mA. 3. replace battery (battery impedance seems high).

  • Progressing on this I have built a battery simulator using the design detailed in TI’s SLVA618 ‘Building Your Own Battery Simulator’. My circuit is as per Fig 1 of that app note with the adds of a 100k pot connecting VIN between +12V and GND so the voltage at BAT+ can be easily set. I also included a jumper allowing Cin to be taken out of circuit when a set fixed voltage level at BAT+ is desired. Connecting the battery simulator in place of the Li cell (Cin out of circuit) I observed the following behaviors.

     Vbat

     Status LED

     Ibat

     2.0

     On

     88 mA

     2.2

     On

     120 mA

     3.0

     On

     380 mA

     3.3

     On

     148 mA

     3.8

     On/Off flashing

     5 to 275 mA

     4.0

     On

     640 mA

     4.1

     On

     330 mA

     4.2

     On

     1 uA


    Comparing that behavior to BQ25616 datasheet ‘Figure 11. Battery Charging Profile’ it appears below 3 volts the circuit is in pre-charge mode. At 3 volts the Vbatlowv threshold is crossed and charging switches to ‘Fast Charge and Voltage Regulation’ mode. With just three data points at 4.0, 4.1, and 4.2 the gradual decline of charge current shown in Figure 11 is not observed. The area around 3.8 volts when STAT is switching on/off and the charge current is likewise switching between 5 and 275 mA is puzzling as to its cause. It is enlightening about the previous testing described above using actual cells as those cells are about 3.7 volts thus also triggering the on/off indecision of the BQ25616.

  • The other question arising using the battery simulator is why does charge current top out at 640 mA when ILIM and ICHG are set respectively to 402 ohms for input current limit 1.18A and 274 ohms sets charge current limit 2.47A?

  • In a response above Hong Mao suggested "2. reduce charge current to  200mA." Trying that suggestion has proven to be fruitful. Changing the ICHG resistor from 274 to 3400 ohms thus reducing max charge current from 2.47A to 200mA and the circuit is much better behaved.

    With one of my test batteries connected and 5VDC supplied to circuit:

    • STAT LED solid on indicating charging
    • SYS node regulates @ 4.2 to 4.3 VDC, well filtered output LC appears to be doing its job
    • SW node shows steady switching at 1.42MHz, I presume this indicates loop working to regulate charging
    • Stable with Fluke 289 meter in battery loop allowing observation of 275 mA of current flowing into battery

    Thanks to Mao's help presently much happier with BQ25616. Let's keep this thread open while next week I increase charge current setting and report results.

  • Good news! Okay, I can keep the thread open for now.

  • BQ25616 testing notes 11-9-2020

    Reset charge current from 275 mA to 1 A changing ICHG resistor to 665 ohms. Tested with a discharged battery started with battery voltage 3.0 VDC and charger started in pre-charge. When voltage reached 3.3 volts circuit became unstable again with status STAT output rapidly switching and charge current into battery dropping to tens of mA.

    Changed ICHG resistor to 1k33 ohms for charge current setting of 500 mA. Connected to same Li battery STAT is on indicating charge with 550 mA measured into cell.

    ICHG resistor back to 665 ohms for 1A charge current. Added 1000 uF capacitance to output LC network (location C2 on schematic posted to parent thread). Connected to test Li battery STAT is on indicating charge with 484 mA measured into cell, why not 1 A?

    Circuit configuration ICHG 665 ohms 1000 uF added to C2 retained with added 1000 uF to C6 on battery input BAT node. Same behavior STAT is on indicating charge with 484 mA measured into cell. In all of the configurations unit is switching at 1.4MHz while regulating output.

    Question remains with ICHG resistor at 665 ohms for 1A charge current why only half that observed?


  • Recalling that this implementation leaves the D+ and D- pins unconnected and is powered off generic +5 VDC supply could the observed ~500 mA limit on charging current be due to IC's DCD (Data Contact Detection) feature reporting power source is "Unknown 5-V Adapter"? The datasheet reports in such a case the input current limit is set by ILIM pin which in this implementation is connected to 408 ohms setting input current limit to 1.18 A. Nothing close to 1.18A draw has been observed on voltage source which is presently a 12 amp adjustable bench supply.

  • Yes, correct, if D+/D- is left floating, input current limit is determined  by the resistor value at ILIM pin and charge current is set by the resistor value at ICHG pin. The actual charge current is determined by both ILIM and ICHG depending which one allows lower charge current. The charge current cannot reach the set value. As I mentioned earlier, this could be caused by the battery impedance. Please measure the voltage at BAT pin, if BAT pin voltage has reached the charge voltage, then the charge current is determined by battery terminal voltage and impedance (CV mode).

  • Hello Hong Mao & readers,

    Testing the BQ25616 circuit is on hold for a couple of weeks due to one of my family members testing positive for Covid-19 and the need for me to quarantine away from the office and my test bench. This occurred as I was preparing to run full testing using batteries purposely discharged with recording logger monitoring voltages and currents so final testing on hold for a couple of weeks.

    In the final hours before testing halted I did observe an issue we can consider while awaiting my access back to the bench. Specifically monitoring the battery voltage as charging continued I observed 4.6 VDC. My understanding is voltage on the cell should regulate at 4.2 VDC (the ‘Regulation Voltage’ illustrated datasheet Fig. 11) as charge current is controlled during Fast Charge then Top Off phases of charging. With VSET pin set to RVSET> 50kΩ(floatpin) = 4.208V why would I see 4.6 rather than 4.2?

  • Hi Norman:

    Yes, the voltage at BAT should be regulated at 4.2V. Do you have waveform scope on BAT voltage? Do you have VBAT and IBAT data log?

  • Hi Mao,

    My quarantine time away from the office/lab prevents me from scoping BAT voltage and recording VBAT and IBAT data logs. Please standby while the days pass until I can get back to this investigation.

    Regards

    Norman Tracy

  • Okay, will wait for your response.

  • Back in the office today I have setup a longer period charge test of the BQ25616 based circuit. Using the smaller test cell (UBBL19 2.4Ah from UltraLife) I pulled 1Ah of charge out of the cell into a test load. The cell was then connected to the BQ25616 circuit which is also connected to a logging meter that will record voltages and current as the test runs overnight. After 3 1/2 hours the battery node is at 3.91 VDC with 270 mA of charge current and the load node (SW) is at 4.21 VDC. It will be interesting to see the results tomorrow morning. One hopes in another 6-7 hours cell voltage reaches Regulation level 4.2v and current the Top Off rate.

  • Here are the results of a 19 hour charge test of the BQ25616 circuit in development charging an UltraLife UBBL19 2.4Ah cell.

    For data logging a Graphtec 200A logger was used to record the cell and load voltages and current into or out of cell across a 1 ohm sense resistor. The sense resistor is in series between cell positive terminal and BQ25616’s BAT node.

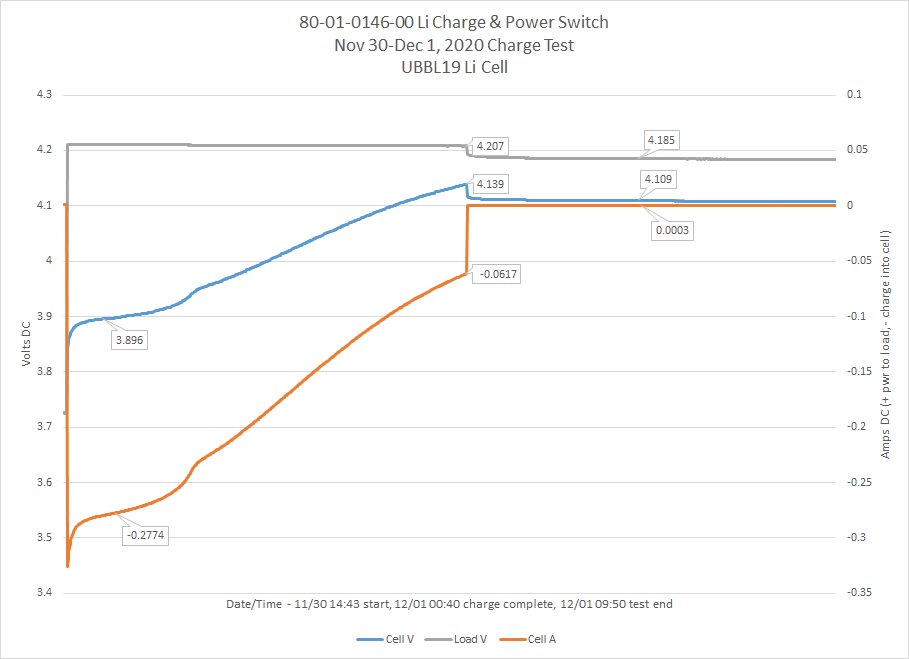
    In the following data graph top grey trace is load voltage, middle blue trace is battery voltage, and bottom orange trace is battery current. Data was recorded for 19 hours starting afternoon until following morning. With data recording started the 5 volt charge voltage was left off for 5 minutes, this is seen on the far left of the graph battery and load voltages ~3.6v and 0.9 mA into test load. Once 5 volt charge voltage was applied load voltage went to 4.2v, battery voltage 3.8v and charge current -277mA. The ICHG set resistor has been changed from 274 to 3.4k ohms therefore initial charge rate is within 2mA of calculated value. Over next 10 hours cell voltage rose as charge current decreased. At 12:40AM when cell voltage reached 4.139v and charge current at -61mA charging ceased. Over next 9 hours load voltage stabilized at 4.18v, cell voltage 4.11v while 0.3mA exited cell into load.

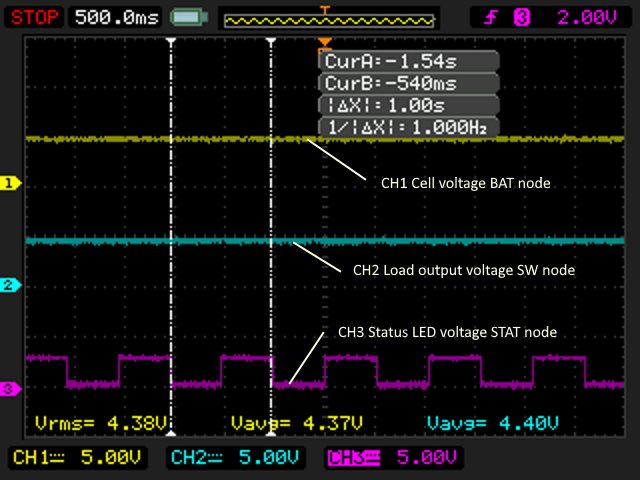
    Upon returning to the bench in the morning the BQ25616 circuit’s STATUS LED was flashing rather than off. Attached oscilloscope capture shows load and cell voltages stable with the ‘scope reading a bit higher than 200A logger. The STATUS LED was cycling at 1 Hz indicating charge suspend fault.

    I am pleased with the voltage and current curves recorded. Disappointed circuit entered error state rather than top off timer.

    Hong Mao (or others) I would appreciate your thoughts as to why with the cell at its charged voltage the BQ25616 declared a charge suspend fault rather than entering top off mode.

  • Hi,

    Thank you very much for your update!

    Ning.

  • You are welcome Ning. Issue is not resolved, need to determine why BQ25616 is not going into STATUS LED off top up mode at end of charge cycle.

  • Upon further review of the BQ25616 data sheet vs test data I concluded previous test had ended with STAT LED flashing an error due to the 10 hour safety timer invoking before the cell completed charging. To test that theory the charge current limit was increased and test rerun.

    Results of a 20 hour charge test of the BQ25616 circuit in development charging an UltraLife UBBL19 2.4Ah cell.

    For data logging a Graphtec 200A logger was used to record the cell and load voltages and current into or out of cell across a 1 ohm sense resistor. The sense resistor is in series between cell positive terminal and BQ25616’s BAT node.

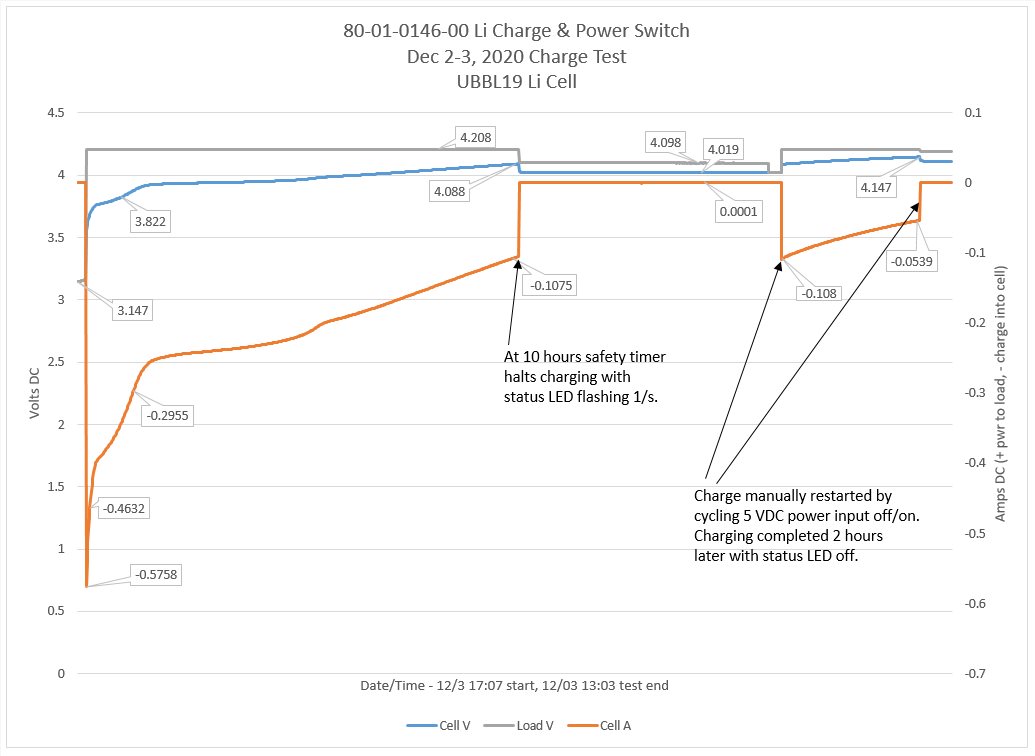
    In the following data graph top grey trace is load voltage, middle blue trace is battery voltage, and bottom orange trace is battery current. Data was recorded for 20 hours starting afternoon until following day with a manual restart. With data recording started the 5 volt charge voltage was left off, this is seen on the far left of the graph battery and load voltages ~3.147v and 0.9 mA into test load. Once 5 volt charge voltage was applied load voltage went to 4.2v, battery voltage 3.8v and charge current began at -463 mA trending to -296mA after a couple of hours. The ICHG set resistor had been changed to 909 ohms for a maximum calculated charge rate of 744 mA. Note that 744 mA is well over the maximum 463 mA observed. After 10 hours during which cell voltage rose as charge current decreased along expected trends the safety timer in the BQ25616 IC halted charging as specified with STATUS LED flashing 1/s indicating time-out fault. The UBBL19 is a 2.4Ah cell that had been thoroughly discharged prior to the test so with much of the 10 hours spent charging at between 150 to 250 mA the ten hour limit expired before the cell completely charged. Charging was manually restarted by cycling the 5 Vdc input power off/on. Charging resumed at a 108 mA rate and after 2 hours exited when cell voltage reached 4.147 Vdc with STATUS LED off indicating charge complete.

    I am pleased with the voltage and current curves recorded. Test confirms theory previous test ending with flashing LED error was due to 10 hour safety timer in BQ25616 IC.

    Next step is to run full charge cycle test with larger capacity MP176065 5.6 Ah cell. That test has been started with initial charge currents over 700 mA observed and now almost 2 hours in running at 536 mA of charge current.
  • Two questions arise from this test:

    1. Why did the BQ25616 error at 58 minutes halting charging early?

    2. Why in this and previous testing is the charge rate set by the ICHG resistor never achieved?

    Results of a 15+ hour charge test of the BQ25616 circuit in development charging an SAFT MP176065 5.6 Ah cell.

    For data logging a Graphtec 200A logger was used to record the cell and load voltages and current into or out of cell across a 0.1 ohm sense resistor. The sense resistor is in series between cell positive terminal and BQ25616’s BAT node. Previous 1 ohm sense R changed to 0.1 ohm testing if the 1 ohm in series with cell was effecting test.

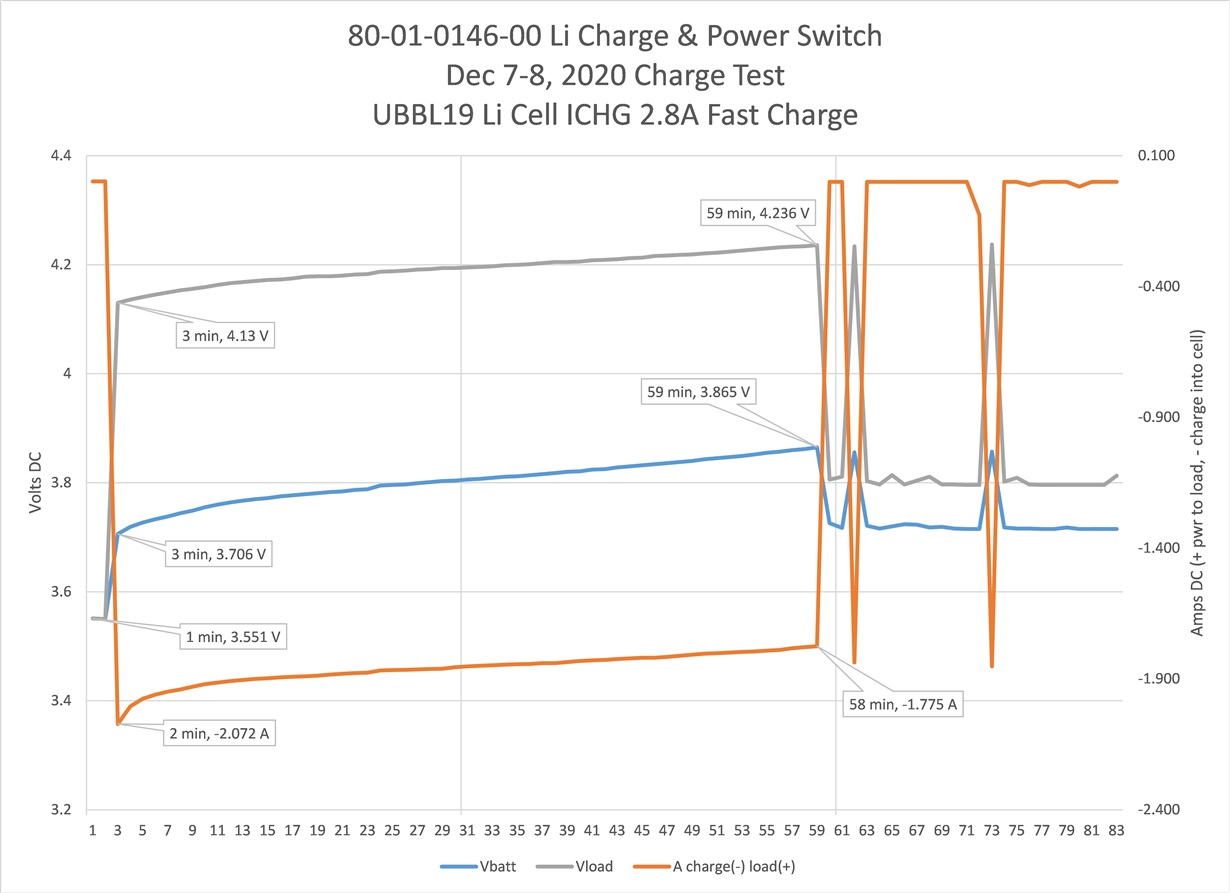
    With 10 hour charge safety timer continuing to expire before cell is charged this test setup for a fast charge configuration. The charge rate was increased to 2800 mA. ICHG resistor = 243 ohms. Input current limit ILIM resistor changed to 150 ohms setting input current limit to 3200 mA. The plan was with 2800 mA available for 10 hours cell should have time to fully charge before safetytimer expires.

    In the following data graph top grey trace is load voltage, middle blue trace is battery voltage, and bottom orange trace is battery current. Data was recorded for 17+ hours, only the first 83 minutes is graphed as remaining behavior is similar to that shown after one hour.

    Programmed maximum charge current is never observed during test. Initial logging recorder samples are with charge power off documenting test cell voltage at 3.55 volts. When charge power is applied 2 amps of charge current are observed at the cell and on bench supplies amp meter. After 58 minutes with charge current at 1.78 A and cell voltage 3.87 V charging terminates. The STATUS LED is flashing and the behavior seen on the graph with occasional charge retries attempted then shut off goes on for next ~16 hours until test is stopped following morning.

    This run demonstrates circuit is capable of charging at rates between 1.75 to 2 A. In theory rates sufficient to charge the target 5.4 Ah cell well before the 10 hour safety timer expires. However the test failed because the BQ25616 declared an error halting charging after ~2 Ah. 


  • Norman,


    1. Why did the BQ25616 error at 58 minutes halting charging early?

    Let's consider all of the fault conditions that can suspend charging.

    - Input over-voltage - please capture VBUS 

    -TS fault - Did the battery get warm? Do you have a value of V_TS/V_REGN [%] when charging stops?

    -safety timer - N/A based on your datalog

    - System overvoltage - N/A based on your datalog

    2. Why in this and previous testing is the charge rate set by the ICHG resistor never achieved?

    There may be a DPM loop active. Your ILIM setting should be good, but what is your D+/D- setting (SDP, CDP, DCP, etc) this could be limiting your input current as well. VINDPM may also be reducing the charge current if VBUS is falling below 4.3V

    Thanks,

    Ricardo

  • Hello Ricardo, thank you for your quick response.

    You commented and asked:

    1. Why did the BQ25616 error at 58 minutes halting charging early?

    Let's consider all of the fault conditions that can suspend charging.

    - Input over-voltage - please capture VBUS NT reply – for the next charge test I will. Presently on test rig VBUS is 5.2 to 5.3 volts.

    -TS fault - Did the battery get warm? Do you have a value of V_TS/V_REGN [%] when charging stops? NT reply –Battery pack did not get warm. By V_TS/V_REGN [%] am I correct presuming you are referencing the divider connecting REGN to TS to GND? I do not know that voltage. Note this design services a cell that does not feature a thermistor so it uses the 10k+10k divider REGN to TS to GND as the datasheet instructs.

    -safety timer - N/A based on your datalog

    - System overvoltage - N/A based on your datalog

    2. Why in this and previous testing is the charge rate set by the ICHG resistor never achieved?

    There may be a DPM loop active. Your ILIM setting should be good, but what is your D+/D- setting (SDP, CDP, DCP, etc) this could be limiting your input current as well. VINDPM may also be reducing the charge current if VBUS is falling below 4.3V NT reply – this design is not intended to be powered from a USB source rather a simple dumb power supply. The D+ and D- pins are therefore left floating. My understanding is according to “Table 2. Input Current Limit Setting from D+/D– Detection” this results in detection declaring ‘Unknown 5-V Adapter’ and input current limit set by ILIM pin. I also wonder if this unknown is why the current profiles I have recorded peak and decay lacking the flat line section at charge current until battery voltage reaches Regulation Voltage as depicted in BQ25616 datasheet Figure 11. Battery Charging Profile.


  • Hello again Ricardo & Power management forum readers,

    The other aspect of the issues I am having is that since running the high current charge test results posted Dec 9, 2020 above I was unable to get the BQ25616 based charger to reenter charge mode. Reconnecting battery and charge supply and it would stick with STATUS LED flashing. Trying two different prototype PCBAs of the circuit and two different batteries swapping PCBAs and cells trying all the combinations. This called into question my bench testing setup. I have been recording the charge currents into the cell using 1 ohm and later 0.1 ohm resistors in series with the cell recording the voltage drop across them to generate the current curves posted above. Removing the measurement resistor, connection to data recorder, and extra wire connecting them added and the STATUS LED is on solid. Judging charge current from the bench supply’s amp meter the charger is presently in low current mode. Is that Pre-charge? Cell voltage is 3.4 volts so based on ‘Figure 11. Battery Charging Profile’ that is above ‘VBATLOWV (3 V)’ and it should enter the ‘Fast Charge and Voltage Regulation’ stage. Is there both a timer and voltage test for Pre-charge to Fast-charge state change?

    Given the apparent sensitivity to a current shunt resistance and extra wiring in the battery side of the circuit I am curious how TI characterizes the part on your test benches? Very low ohm current shunts? Magnetic clip on current probe? Measure current into VBUS node to infer that during charging +99% of that goes out the BAT node?

  • Norman,

    For our setups we typically use a sourcemeter. This allows us to measure the current sourced and sunk while regulating voltage output. Alternatively, we do use 10-mohm or 20m-ohm sense resistors when working with real battery packs. We never use sense resistors in the 100s of milliohms as we start to run into problems.

    Personally I like to avoid magnetic current probes for measurements of less than 1A.

    1. Why did the BQ25616 error at 58 minutes halting charging early?

    Let's consider all of the fault conditions that can suspend charging. We have eliminated TS fault and safety timer fault. 

    I will await your next datalog to see if input OVP is being hit or system OVP. I have brought system OVP back into question as I do not know your sample rate. Your datalog may have missed the trigger event. I am not sure if you have access to DMM with a max value function, but that is how I would try to capture the peak values seen on SYS and VBUS without have a crazy high sample rate on your datalogger.

     Why in this and previous testing is the charge rate set by the ICHG resistor never achieved?

    I see. You are correct. If D+/D- are floating ILIM will set your input current limit. Assuming you do not have a system load present, it is not likely that you are in IINDPM. Your VBUS datalog output will tell us if you are in VINDPM.

    Best Regards,

    Ricardo

  • Hello Ricardo and fellow toilers in the fields of electrons storage via chemical means.

    Thanks for your input on current measurements and the theory OVP halted the previous test out of fast charge mode. We do have a couple of DMM with max value function I will use during this weekend’s testing on SYS and VBUS.

    Presently my biggest issue remains understanding factors effecting charging current. Tests run Dec 8-9 and Dec 9-10 set the BQ25616 near its highest specified charge rates. For the 8-9 test ICHG @ 1.99A (R=340ohms) then 9-10th test ICHG @ 2.78A (R=243 ohms). In both cases ILIM 3.18A (R=150 ohms). In both ~16 hour tests charge currents of ~230-240 mA were raised as the cell voltage varied 3.6 to 3.7 VDC for the first 3.2 to 3.4 VDC on the second night. After 1 – 2 hours STATUS goes from ON to flashing and charging essentially stops.

    For today’s bench experiments I used both cells and the TI App note battery simulator. With the ILIM=150 ohms and ICHG =243 ohms it was confirmed it would charge the SAFT 176065 cell at ~230 mA. Duplicated previous night’s test rate. Replacing the cell with the power op-amp battery simulator sink that configuration raised 400 mA of charge current. Suspecting setting the ILIM and ICHG so ‘wide open’ as a cause ICHG was changed to 1.02A (R=665 ohms). No change to ILIM. With ILIM at 3.18A and ICHG at 1A the circuit raised 750 mA into the battery simulator. Replacing the battery simulator with a discharged cell I observed:

    231 mA charge current battery voltage 3.09v

    233 mA charge current battery voltage 3.33v

    753 mA charge current battery voltage 3.52v

    Reading from the data logger’s small screen the transition to 750 mA charge occurred ~15 minutes into the test. As I type this 70 minutes into the test still charging at 750 mA.

    Comments? It appears backing ICHG down to 1A helps but I continue to puzzle that calculations yield 1A charge current and on the bench 750 mA is seen. Is the BQ25616 reacting to the impedance of the cell (or battery simulator) and loop Z of PCB and connecting wires? Revisit SW output inductor or protection MOSFET on VBUS? The plan is to let this test run and see if the circuit attains a flat constant current charge through the Fast Charge phase then taper I off at Voltage Regulation.

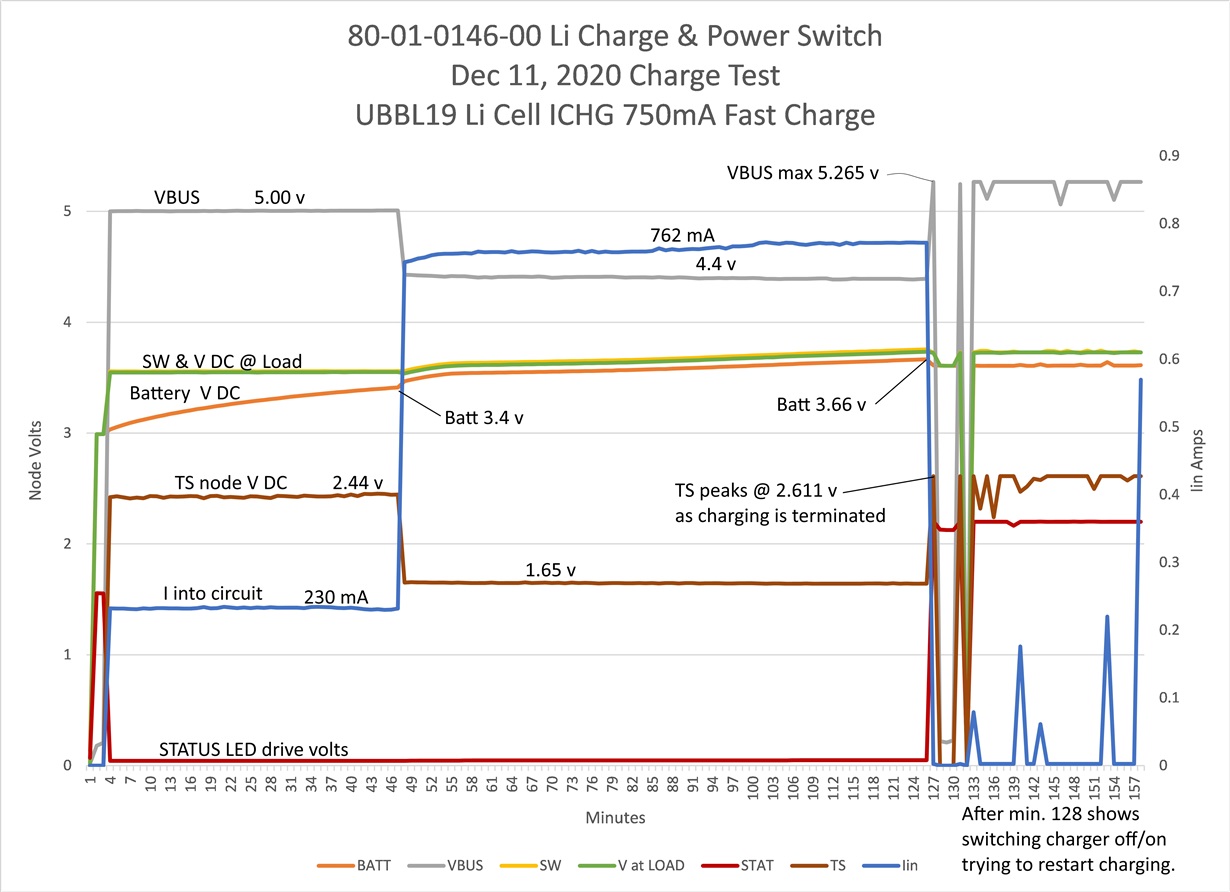
  • Results of a 2 hour charge test of the BQ25616 circuit in development charging an SAFT MP176065 5.6 Ah cell.

    For data logging a Graphtec 200A logger was used to record the cell and load voltages and current into or out of cell across a 1 ohm sense resistor. The sense resistor is in series between bench supply and circuit input.

    Suspecting setting the ILIM and ICHG to ‘wide open’ maximum setting as an issue in previous fails ICHG was changed to 1.02A (R=665 ohms). No change to ILIM (R=150 ohms). With ILIM at 3.18A and ICHG at 1A the circuit raised 750 mA into the battery simulator.

    In the following data graph additional nodes are being recorded as labeled on graph.

    Programmed maximum charge current is never observed during test. Initial logging recorder samples are with charge power off documenting test cell voltage at ~3 volts. When charge power is applied 230 mA of charge current are observed until after 45 minutes when battery voltage reaches 3.4 volts charge current increased to 750 mA. Charge current is held stable between 750 to 765 mA until just after 2 hours into test with battery voltage at 3.66 volts charging is terminated and STATUS goes high. As charging terminated a peak at 2.611 volts was recorded on node TS. Attempts to restart charging by cycling power on VBUS were unsuccessful. Even turning off charge power and disconnecting battery to force IC reset resulting in error flashing STATUS LED when battery was reconnected and charge power reapplied.

    Noting drop on VBUS to 4.4 vdc due to current shunt the next test will replace 1 ohn current shunt with 0.11 ohm and also implement capture of overvoltage events on VBUS and SYS nodes using Fluke 289 meters.

  • Norman,

    It definitely looks like you are in VINDPM during fast charge and that is the reason you are not seeing your full charge current. This is most likely due to your large sense resistor.

    I feel this method of doing a two hour charge with a real battery is very time consuming with you. DO you have an electronic load, bidirectional power amplifier, or sourcemeter you could use to simulate a battery? 

    Thanks,

    Ricardo

  • Hello Ricardo,

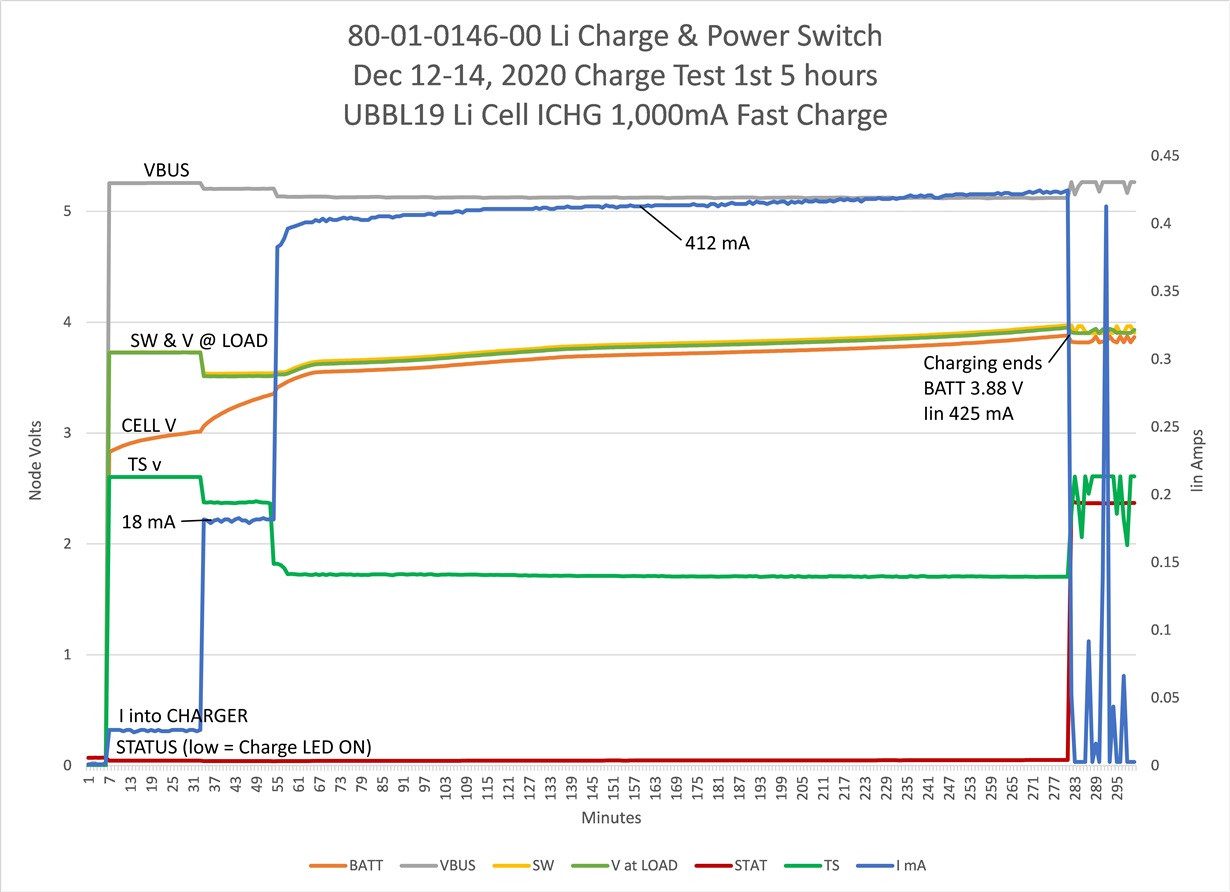
    Reviewing the 17 mentions of "VINDPM" in the datasheet it is not clicking to me what being 'in VINDPM' and more to the point how to control that state. For example section 9.3.3.5 says there are two modes to set it fixed and tracking but not what controls which the device uses. In Table 3 for standalone configuration (as I designed for) VINDPM is stated as '4.3 V and Vbat + 200 mV'. Yet in the charge test I post below the battery voltage peaks at 3.88 V. while device charges at ~400 mA. Is 1st paragraph of 9.3.6.2 the key?

    9.3.6.2 Dynamic Power Management
    To meet the maximum current limit in the USB specification and avoid overloading the adapter, the device
    features Dynamic Power Management (DPM), which continuously monitors the input current and input voltage.
    When input source is overloaded, either the current exceeds the input current limit (IINDPM) or the voltage falls
    below the input voltage limit (VINDPM). The device then reduces the charge current until the input current falls
    below the input current limit or the input voltage rises above the input voltage limit.

    To me very counter intuitive, specifically I took Table 2 that with no D-D+ pins connection my circuit would be 'Unknown 5-V Adapter' IINDPM Set by ILIM pin. So for Saturday's test that is one amp. So current exceeds the input current limit is false. But then or the voltage falls below the input voltage limit (VINDPM) which if  its '4.3 V and Vbat + 200 mV' will always be true?? In short 4.3 v is the target for a charged battery so to me the logic is always 'in VINDPM' state. What am I missing?

    Regarding testing I have built the Battery Simulator detailed in TI Application Report SLVA618. As noted in one of the posts above I have tended to use it set to ~3 volts to simulate a deeply discharged cell. If I connect it to the circuit and vary its voltage between 3 to 4.3 Vdc would you expect at some point the ILIM set charge current to be sourced?

    And here is a test run over last weekend. Charged for 5 hours loading 1.6 Ah into the cell before terminating at cell voltage of 3.88v. VBUS and SYS were monitored with Fluke 289s in min/avg/max mode showing maximum VBUS = 5.261v and maximum SYS 4.275v.

  • Today’s investigations looked into the battery voltage levels at which the BQ25616 changes charge current delivered to the cell. With VBAT power at 5.25 VDC and the current limit remaining ICHG 1.02A (R=665 ohms) and ILIM 3.2A (R=150 ohms) the SAFT cell was replaced with the Battery Simulator detailed in TI Application Report SLVA618 and all current shunt resistor or current meters removed from the circuit. The current listed below were read from the +-12 VDC bench supply powering the battery simulator, as it sinks the charge current it shows on the -12 volt rail’s current meter with 2-digit resolution. For the test two different prototype PCBAs of the circuit were presented with voltages at their BAT between 2.0 V (min volts before cell’s protection circuit disconnects it) to 4.25 V (cell fully charged). Voltage increased in 0.25 volt increments with an extra data point at 3.8 volts as this was an obvious transition point.

    Volts at BAT        Charge mA proto #1             mA proto #2

    2.0                        90                                         100

    2.25                      90                                         100

    2.5                        90                                         100

    3.0                        50                                         60

    3.25                      50                                         60

    3.5                        50                                         60

    3.8                        300-500                              10 – 280

    4.0                        915                                      10-60

    4.25                      940                                      910

    Comparing the above result to datasheet’s “Figure 11. Battery Charging Profile” is very puzzling. Figure 11 shows below 2.2 V one expects lowest charge instead we see 90-100 mA. Fig. 11 shows between 2.2 and 3 volts higher current for Vbatlow region, on the bench current drops 40 mA. Those numbers do seem to be in line with “Table 5. Charging Current Setting” note that in Iprechg region default current setting is 5% of ICHG pin setting. Table 5 also says that should be 2.2 to 3 V while on my bench it looks more like 3 to 3.7 V. And also Table 5 state “> 3 V” charge current should be ICHG pin setting while on the bench that happens 4 – 4.25 V.

    It’s as if the BQ25616’s sensing of BAT node voltage is off by one volt. What mistakes could I have made that would cause such an error?