

Other Parts Discussed in Thread: DRA821, , TDA4VH, DRA829
I need to see Ethernet statistics for CPSW on TDA4/DRA8 devices for debugging. Is there any way for me to read them?

This thread has been locked.
If you have a related question, please click the "Ask a related question" button in the top right corner. The newly created question will be automatically linked to this question.
Hi All,
The CPSW IP has an statistics module where multiple stats are recorded for all the ports of the IP. The description and register addresses for the individual stats can be found in the TRM (Section - 12.2.2.4.6.19, Title - CPSW Network Statistics) of the SoC. To read these statistics easily, we have the following tools in place.
MCU_Cortex_R5_0: GEL Output:           STATS
MCU_Cortex_R5_0: GEL Output: --------------------------------
MCU_Cortex_R5_0: GEL Output:           PORT0 STATS
MCU_Cortex_R5_0: GEL Output: --------------------------------
MCU_Cortex_R5_0: GEL Output: STAT_0_RXGOODFRAMES              = 0x0002F960
MCU_Cortex_R5_0: GEL Output: STAT_0_RXBROADCASTFRAMES         = 0x0000193B
MCU_Cortex_R5_0: GEL Output: STAT_0_RXMULTICASTFRAMES         = 0x0000012C
MCU_Cortex_R5_0: GEL Output: STAT_0_RXOCTETS                  = 0x01049D67
MCU_Cortex_R5_0: GEL Output: STAT_0_TXGOODFRAMES              = 0x00006AD5
MCU_Cortex_R5_0: GEL Output: STAT_0_TXBROADCASTFRAMES         = 0x0000193C
MCU_Cortex_R5_0: GEL Output: STAT_0_TXMULTICASTFRAMES         = 0x000025A7
MCU_Cortex_R5_0: GEL Output: STAT_0_TXOCTETS                  = 0x005AAD86
MCU_Cortex_R5_0: GEL Output: STAT_0_OCTETFRAMES64             = 0x000057BB
MCU_Cortex_R5_0: GEL Output: STAT_0_OCTETFRAMES65T127         = 0x0002C0DE
MCU_Cortex_R5_0: GEL Output: STAT_0_OCTETFRAMES128T255        = 0x00000113
MCU_Cortex_R5_0: GEL Output: STAT_0_OCTETFRAMES256T511        = 0x00004A86
MCU_Cortex_R5_0: GEL Output: STAT_0_OCTETFRAMES512T1023       = 0x00000003
MCU_Cortex_R5_0: GEL Output: STAT_0_NETOCTETS                 = 0x015F4AED
MCU_Cortex_R5_0: GEL Output: STAT_0_TX_PRI_REG             [0]= 0x00006AD5
MCU_Cortex_R5_0: GEL Output: STAT_0_TX_PRI_BCNT_REG        [0]= 0x005AAD86
MCU_Cortex_R5_0: GEL Output: --------------------------------
MCU_Cortex_R5_0: GEL Output:           PORT1 STATS
MCU_Cortex_R5_0: GEL Output: --------------------------------
MCU_Cortex_R5_0: GEL Output: --------------------------------
MCU_Cortex_R5_0: GEL Output:           PORT2 STATS
MCU_Cortex_R5_0: GEL Output: --------------------------------
MCU_Cortex_R5_0: GEL Output: STAT_2_RXGOODFRAMES              = 0x0000E330
MCU_Cortex_R5_0: GEL Output: STAT_2_RXBROADCASTFRAMES         = 0x00000002
MCU_Cortex_R5_0: GEL Output: STAT_2_RXMULTICASTFRAMES         = 0x0000B73C
MCU_Cortex_R5_0: GEL Output: STAT_2_ALE_DROP                  = 0x0000919E
MCU_Cortex_R5_0: GEL Output: STAT_2_RXOCTETS                  = 0x00C4315A
MCU_Cortex_R5_0: GEL Output: STAT_2_TXGOODFRAMES              = 0x0002DF9A
MCU_Cortex_R5_0: GEL Output: STAT_2_TXBROADCASTFRAMES         = 0x00000002
MCU_Cortex_R5_0: GEL Output: STAT_2_TXMULTICASTFRAMES         = 0x0000009F
MCU_Cortex_R5_0: GEL Output: STAT_2_TXOCTETS                  = 0x00E33C1A
MCU_Cortex_R5_0: GEL Output: STAT_2_OCTETFRAMES64             = 0x000057BB
MCU_Cortex_R5_0: GEL Output: STAT_2_OCTETFRAMES65T127         = 0x0002CD89
MCU_Cortex_R5_0: GEL Output: STAT_2_OCTETFRAMES128T255        = 0x00006D84
MCU_Cortex_R5_0: GEL Output: STAT_2_OCTETFRAMES256T511        = 0x00002FFC
MCU_Cortex_R5_0: GEL Output: STAT_2_OCTETFRAMES512T1023       = 0x00000006
MCU_Cortex_R5_0: GEL Output: STAT_2_NETOCTETS                 = 0x01A76D74
MCU_Cortex_R5_0: GEL Output: STAT_2_PORTMASK_DROP             = 0x0000919E
MCU_Cortex_R5_0: GEL Output: STAT_2_ALE_VID_INGRESS_DROP      = 0x00005BD0
MCU_Cortex_R5_0: GEL Output: STAT_2_ALE_UNKN_UNI              = 0x00002BF2
MCU_Cortex_R5_0: GEL Output: STAT_2_ALE_UNKN_UNI_BCNT         = 0x000B13A4
MCU_Cortex_R5_0: GEL Output: STAT_2_ALE_UNKN_MLT              = 0x0000B73C
MCU_Cortex_R5_0: GEL Output: STAT_2_ALE_UNKN_MLT_BCNT         = 0x00B91D36
MCU_Cortex_R5_0: GEL Output: STAT_2_ALE_UNKN_BRD              = 0x00000002
MCU_Cortex_R5_0: GEL Output: STAT_2_ALE_UNKN_BRD_BCNT         = 0x00000080
MCU_Cortex_R5_0: GEL Output: STAT_2_TX_PRI_REG             [0]= 0x0002DF9A
MCU_Cortex_R5_0: GEL Output: STAT_2_TX_PRI_BCNT_REG        [0]= 0x00E33C1A
MCU_Cortex_R5_0: GEL Output: --------------------------------
MCU_Cortex_R5_0: GEL Output:           PORT3 STATS
MCU_Cortex_R5_0: GEL Output: --------------------------------
MCU_Cortex_R5_0: GEL Output: --------------------------------
MCU_Cortex_R5_0: GEL Output:           PORT4 STATS
MCU_Cortex_R5_0: GEL Output: --------------------------------
MCU_Cortex_R5_0: GEL Output: STAT_4_RXGOODFRAMES              = 0x00003389
MCU_Cortex_R5_0: GEL Output: STAT_4_RXBROADCASTFRAMES         = 0x00003271
MCU_Cortex_R5_0: GEL Output: STAT_4_RXMULTICASTFRAMES         = 0x00000118
MCU_Cortex_R5_0: GEL Output: STAT_4_ALE_DROP                  = 0x00001A46
MCU_Cortex_R5_0: GEL Output: STAT_4_RXOCTETS                  = 0x0043BF9D
MCU_Cortex_R5_0: GEL Output: STAT_4_TXGOODFRAMES              = 0x000019C6
MCU_Cortex_R5_0: GEL Output: STAT_4_TXBROADCASTFRAMES         = 0x00001939
MCU_Cortex_R5_0: GEL Output: STAT_4_TXMULTICASTFRAMES         = 0x0000008D
MCU_Cortex_R5_0: GEL Output: STAT_4_TXOCTETS                  = 0x0021614D
MCU_Cortex_R5_0: GEL Output: STAT_4_OCTETFRAMES65T127         = 0x0000018F
MCU_Cortex_R5_0: GEL Output: STAT_4_OCTETFRAMES128T255        = 0x00000016
MCU_Cortex_R5_0: GEL Output: STAT_4_OCTETFRAMES256T511        = 0x00004BAA
MCU_Cortex_R5_0: GEL Output: STAT_4_NETOCTETS                 = 0x006520EA
MCU_Cortex_R5_0: GEL Output: STAT_4_PORTMASK_DROP             = 0x00001A46
MCU_Cortex_R5_0: GEL Output: STAT_4_ALE_VID_INGRESS_DROP      = 0x000019BF
MCU_Cortex_R5_0: GEL Output: STAT_4_ALE_UNKN_MLT              = 0x00000118
MCU_Cortex_R5_0: GEL Output: STAT_4_ALE_UNKN_MLT_BCNT         = 0x00005CA4
MCU_Cortex_R5_0: GEL Output: STAT_4_ALE_UNKN_BRD              = 0x00003271
MCU_Cortex_R5_0: GEL Output: STAT_4_ALE_UNKN_BRD_BCNT         = 0x004362F9
MCU_Cortex_R5_0: GEL Output: STAT_4_TX_PRI_REG             [0]= 0x000019C6
MCU_Cortex_R5_0: GEL Output: STAT_4_TX_PRI_BCNT_REG        [0]= 0x0021614D
ethtool -t $IF_NAME
 Port 0 Statistics
-----------------------------------------
  rxGoodFrames            = 56
  rxBcastFrames           = 16
  rxMcastFrames           = 40
  aleDrop                 = 42
  rxOctets                = 9712
  txGoodFrames            = 573
  txBcastFrames           = 220
  txMcastFrames           = 353
  txOctets                = 65372
  octetsFrames64          = 210
  octetsFrames65to127     = 299
  octetsFrames128to255    = 41
  octetsFrames256to511    = 71
  octetsFrames512to1023   = 8
  netOctets               = 75084
  portMaskDrop            = 42
  alePolicyMatch          = 6
  txPri[0]                = 573
  txPriBcnt[0]            = 65372


 External Port 0 Statistics
-----------------------------------------


 External Port 1 Statistics
-----------------------------------------


 External Port 2 Statistics
-----------------------------------------


 External Port 3 Statistics
-----------------------------------------
  rxGoodFrames            = 855
  rxBcastFrames           = 365
  rxMcastFrames           = 489
  aleDrop                 = 290
  rxOctets                = 107985
  octetsFrames64          = 213
  octetsFrames65to127     = 474
  octetsFrames128to255    = 26
  octetsFrames256to511    = 133
  octetsFrames512to1023   = 9
  netOctets               = 107985
  portMaskDrop            = 290
  aleVidIngressDrop       = 289
  aleUnknownUcast         = 1
  aleUnknownUcastBcnt     = 96
  aleUnknownMcast         = 489
  aleUnknownMcastBcnt     = 57352
  aleUnknownBcast         = 365
  aleUnknownBcastBcnt     = 50537
  alePolicyMatch          = 95


 External Port 4 Statistics
-----------------------------------------
  rxGoodFrames            = 29
  rxBcastFrames           = 7
  rxMcastFrames           = 22
  aleDrop                 = 15
  rxOctets                = 5543
  txGoodFrames            = 14
  txBcastFrames           = 10
  txMcastFrames           = 4
  txOctets                = 4008
  octetsFrames65to127     = 13
  octetsFrames128to255    = 13
  octetsFrames256to511    = 17
  netOctets               = 9551
  portMaskDrop            = 15
  aleUnknownMcast         = 9
  aleUnknownMcastBcnt     = 1274
  aleUnknownBcast         = 3
  aleUnknownBcastBcnt     = 1038
  alePolicyMatch          = 7
  txPri[0]                = 10
  txPri[2]                = 4
  txPriBcnt[0]            = 2592
  txPriBcnt[2]            = 1416


 External Port 5 Statistics
-----------------------------------------


 External Port 6 Statistics
-----------------------------------------


 External Port 7 Statistics
-----------------------------------------
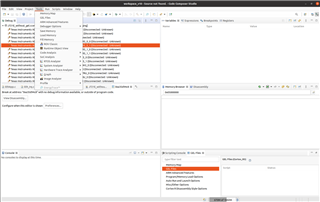
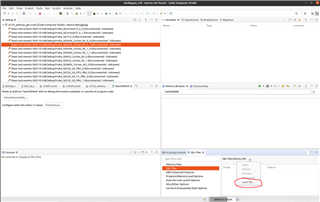
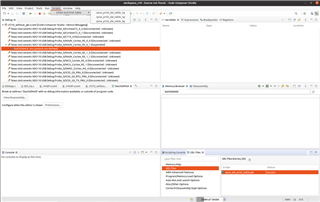
In some cases, it might be possible that you do not have a ethfw UART available on board, in those cases a patch needs to be applied to ethfw to enable periodic dump of stats to the IPC buffer which can be viewed from Linux. The patch is available in the following attachment and is tested on SDK 8.6.
Attachment : 6685.CPSW_Periodic_stat_dump.zip
git init - to create an empty git repositorygit add . - to add all the files to the git repogit commit -m "Initial Commit" - to do the first commit git am [Path_to_0001-Adds-support-for-periodic-CPSW-stat-collection.patch]" to apply the patchmake ethfw_all BUILD_SOC_LIST=<SOC_NAME>
=======================================================
            CPSW Ethernet Firmware
=======================================================
Warning: Using 6 MAC address(es) from static pool
ETHFW: Shared multicasts (software fanout):
  01:00:5e:00:00:01
  01:00:5e:00:00:fb
  01:00:5e:00:00:fc
  33:33:00:00:00:01
  33:33:ff:1d:92:c2
  01:80:c2:00:00:00
  01:80:c2:00:00:03
ETHFW: Reserved multicasts:
  01:80:c2:00:00:0e
  01:1b:19:00:00:00
EnetMcm: CPSW_5G on MAIN NAVSS
Mdio_open: MDIO manual mode enabled
PHY 16 is alive
PHY 17 is alive
PHY 18 is alive
PHY 19 is alive
EnetPhy_bindDriver: PHY 16: OUI:0001c1 Model:27 Ver:00 <-> 'vsc8514' : OK
EnetPhy_bindDriver: PHY 17: OUI:0001c1 Model:27 Ver:00 <-> 'vsc8514' : OK
EnetPhy_bindDriver: PHY 18: OUI:0001c1 Model:27 Ver:00 <-> 'vsc8514' : OK
EnetPhy_bindDriver: PHY 19: OUI:0001c1 Model:27 Ver:00 <-> 'vsc8514' : OK

ETHFW Version   : 0.02.00
ETHFW Build Date: Apr 12, 2023
ETHFW Build Time: 10:31:18
ETHFW Commit SHA: 0909933c


 NETWORK TASK
Starting lwIP, local interface IP is dhcp-enabled
Host MAC address: 70:ff:76:1d:92:c3
[LWIPIF_LWIP] Enet LLD netif initialized successfully
[LWIPIF_LWIP_IC] Interface started successfully
[LWIPIF_LWIP_IC] NETIF INIT SUCCESS
[LWIPIF_LWIP_IC] Interface started successfully
[LWIPIF_LWIP_IC] NETIF INIT SUCCESS
Added interface 'br4', IP is 0.0.0.0
CpswProxyServer: Virtual port configuration:
  mpu_1_0 <-> Switch port 0: mpu_1_0_ethswitch-device-0
  mcu_2_1 <-> Switch port 1: mcu_2_1_ethswitch-device-1
  mpu_1_0 <-> MAC port 1: mpu_1_0_ethmac-device-1
  mcu_2_1 <-> MAC port 4: mcu_2_1_ethmac-device-4
CpswProxyServer: initialization completed (core: mcu2_0)
CpswMacPort_checkSgmiiStatus: MAC 2: SGMII link parter config port: link up: 1-Gbps Full-Duplex
Cpsw_handleLinkUp: Port 2: Link up: 1-Gbps Full-Duplex

 ====== Iteration 1 =====

 Port 0 Statistics
-----------------------------------------
  txGoodFrames            = 2
  txBcastFrames           = 2
  txOctets                = 674
  octetsFrames256to511    = 2
  netOctets               = 674
  txPri[0]                = 2
  txPriBcnt[0]            = 674

 External Port 1 Statistics
-----------------------------------------

 External Port 2 Statistics
-----------------------------------------
  rxGoodFrames            = 9
  rxBcastFrames           = 2
  rxMcastFrames           = 7
  aleDrop                 = 7
  rxOctets                = 1369
  octetsFrames65to127     = 6
  octetsFrames128to255    = 1
  octetsFrames256to511    = 2
  netOctets               = 1369
  portMaskDrop            = 7
  aleUnknownBcast         = 1
  aleUnknownBcastBcnt     = 337

 External Port 3 Statistics
-----------------------------------------
REMOTE_SERVICE: Init ... !!!
REMOTE_SERVICE: Init ... Done !!!
Function:CpswProxyServer_attachExtHandlerCb,HostId:0,CpswType:5
Function:CpswProxyServer_attachExtHandlerCb,HostId:0,CpswType:5
Function:CpswProxyServer_registerMacHandlerCb,HostId:0,Handle:a2bbd168,CoreKey:38acb7e6, MacAddress:70:ff:76:1d:92:c2, FlowIdx:85, FlowIdxOf
fset:1
Function:CpswProxyServer_setPromiscModeHandlerCb,HostId:0,Handle:a2bbd168,CoreKey:38acb7e6,mode:disable
Function:CpswProxyServer_setPromiscModeHandlerCb,HostId:0,Handle:a2bbd168,CoreKey:38acb7e6,mode:disable
Function:CpswProxyServer_registerMacHandlerCb,HostId:0,Handle:a2bbd168,CoreKey:38acb7e6, MacAddress:70:ff:76:1d:92:c1, FlowIdx:84, FlowIdxOf
fset:0
Cpsw_ioctlInternal: CPSW: Registered MAC address. ALE entry:7, Policer Entry:2
Function:CpswProxyServer_filterAddMacHandlerCb,HostId:0,Handle:a2bbd168,CoreKey:38acb7e6, MacAddress:33:33:0:0:0:1, vlanId:0, FlowIdx:84, Fl
owIdOffset:0
Function:CpswProxyServer_filterAddMacHandlerCb,HostId:0,Handle:a2bbd168,CoreKey:38acb7e6, MacAddress:1:0:5e:0:0:1, vlanId:0, FlowIdx:84, Flo
wIdOffset:0
Function:CpswProxyServer_filterAddMacHandlerCb,HostId:0,Handle:a2bbd168,CoreKey:38acb7e6, MacAddress:33:33:ff:1d:92:c1, vlanId:0, FlowIdx:84
, FlowIdOffset:0
Function:CpswProxyServer_setPromiscModeHandlerCb,HostId:0,Handle:a2bbd168,CoreKey:38acb7e6,mode:disable
Function:CpswProxyServer_filterAddMacHandlerCb,HostId:0,Handle:a2bbd168,CoreKey:38acb7e6, MacAddress:1:80:c2:0:0:0, vlanId:0, FlowIdx:84, Fl
owIdOffset:0
Function:CpswProxyServer_filterAddMacHandlerCb,HostId:0,Handle:a2bbd168,CoreKey:38acb7e6, MacAddress:1:80:c2:0:0:3, vlanId:0, FlowIdx:84, Fl
owIdOffset:0
Function:CpswProxyServer_filterAddMacHandlerCb,HostId:0,Handle:a2bbd168,CoreKey:38acb7e6, MacAddress:1:80:c2:0:0:e, vlanId:0, FlowIdx:84, Fl
owIdOffset:0
CpswProxyServer_isRsvdMcast: Reserved mcast cannot be added to filter
Function:CpswProxyServer_setPromiscModeHandlerCb,HostId:0,Handle:a2bbd168,CoreKey:38acb7e6,mode:disable
Function:CpswProxyServer_filterAddMacHandlerCb,HostId:0,Handle:a2bbd168,CoreKey:38acb7e6, MacAddress:33:33:0:0:0:fb, vlanId:0, FlowIdx:84, F
lowIdOffset:0

 ====== Iteration 2 =====

 Port 0 Statistics
-----------------------------------------
  rxGoodFrames            = 12
  rxBcastFrames           = 3
  rxMcastFrames           = 9
  aleDrop                 = 9
  rxOctets                = 1886
  txGoodFrames            = 3
  txBcastFrames           = 3
  txOctets                = 1011
  octetsFrames65to127     = 9
  octetsFrames256to511    = 6
  netOctets               = 2897
  portMaskDrop            = 9
  alePolicyMatch          = 1
  txPri[0]                = 3
  txPriBcnt[0]            = 1011

 External Port 1 Statistics
-----------------------------------------

 External Port 2 Statistics
-----------------------------------------
  rxGoodFrames            = 11
  rxBcastFrames           = 3
  rxMcastFrames           = 8
  aleDrop                 = 8
  rxOctets                = 1780
  txGoodFrames            = 3
  txBcastFrames           = 2
  txMcastFrames           = 1
  txOctets                = 781
  octetsFrames65to127     = 8
  octetsFrames128to255    = 1
  octetsFrames256to511    = 5
  netOctets               = 2561
  portMaskDrop            = 8
  aleUnknownBcast         = 2
  aleUnknownBcastBcnt     = 674
  txPri[0]                = 2
  txPri[2]                = 1
  txPriBcnt[0]            = 427
  txPriBcnt[2]            = 354

 External Port 3 Statistics
-----------------------------------------
Function:CpswProxyServer_setPromiscModeHandlerCb,HostId:0,Handle:a2bbd168,CoreKey:38acb7e6,mode:disable
Function:CpswProxyServer_filterAddMacHandlerCb,HostId:0,Handle:a2bbd168,CoreKey:38acb7e6, MacAddress:33:33:0:1:0:3, vlanId:0, FlowIdx:84, Fl
owIdOffset:0

 ====== Iteration 3 =====

 Port 0 Statistics
-----------------------------------------
  rxGoodFrames            = 43
  rxBcastFrames           = 8
  rxMcastFrames           = 34
  aleDrop                 = 30
  rxOctets                = 6650
  txGoodFrames            = 6
  txBcastFrames           = 4
  txMcastFrames           = 1
  txOctets                = 1559
  octetsFrames65to127     = 30
  octetsFrames128to255    = 7
  octetsFrames256to511    = 12
  netOctets               = 8209
  portMaskDrop            = 30
  alePolicyMatch          = 14
  txPri[0]                = 6
  txPriBcnt[0]            = 1559

 External Port 1 Statistics
-----------------------------------------

 External Port 2 Statistics
-----------------------------------------
  rxGoodFrames            = 14
  rxBcastFrames           = 4
  rxMcastFrames           = 9
  aleDrop                 = 8
  rxOctets                = 2328
  txGoodFrames            = 13
  txBcastFrames           = 5
  txMcastFrames           = 7
  txOctets                = 2688
  octetsFrames65to127     = 15
  octetsFrames128to255    = 3
  octetsFrames256to511    = 9
  netOctets               = 5016
  portMaskDrop            = 8
  aleUnknownMcast         = 1
  aleUnknownMcastBcnt     = 90
  aleUnknownBcast         = 2
  aleUnknownBcastBcnt     = 674
  alePolicyMatch          = 2
  txPri[0]                = 11
  txPri[2]                = 2
  txPriBcnt[0]            = 1980
  txPriBcnt[2]            = 708

 External Port 3 Statistics
-----------------------------------------

 ====== Iteration 4 =====

 Port 0 Statistics
-----------------------------------------
  rxGoodFrames            = 47
  rxBcastFrames           = 10
  rxMcastFrames           = 35
  aleDrop                 = 32
  rxOctets                = 7488
  txGoodFrames            = 8
  txBcastFrames           = 5
  txMcastFrames           = 1
  txOctets                = 1978
  octetsFrames65to127     = 33
  octetsFrames128to255    = 7
  octetsFrames256to511    = 15
  netOctets               = 9466
  portMaskDrop            = 32
  alePolicyMatch          = 14
  txPri[0]                = 8
  txPriBcnt[0]            = 1978

 External Port 1 Statistics
-----------------------------------------

 External Port 2 Statistics
-----------------------------------------
  rxGoodFrames            = 17
  rxBcastFrames           = 5
  rxMcastFrames           = 10
  aleDrop                 = 9
  rxOctets                = 2821
  txGoodFrames            = 15
  txBcastFrames           = 6
  txMcastFrames           = 7
  txOctets                = 3115
  octetsFrames65to127     = 18
  octetsFrames128to255    = 3
  octetsFrames256to511    = 11
  netOctets               = 5936
  portMaskDrop            = 9
  aleUnknownUcast         = 1
  aleUnknownUcastBcnt     = 82
  aleUnknownMcast         = 1
  aleUnknownMcastBcnt     = 90
  aleUnknownBcast         = 3
  aleUnknownBcastBcnt     = 1011
  alePolicyMatch          = 3
  txPri[0]                = 13
  txPri[2]                = 2
  txPriBcnt[0]            = 2407
  txPriBcnt[2]            = 708

 External Port 3 Statistics
-----------------------------------------ethtool -S $IF_NAME
root@j7200-evm:~# ethtool -S eth2
NIC statistics:
     p0_rx_good_frames: 345
     p0_rx_broadcast_frames: 21
     p0_rx_multicast_frames: 98
     p0_rx_crc_errors: 0
     p0_rx_oversized_frames: 0
     p0_rx_undersized_frames: 0
     p0_ale_drop: 0
     p0_ale_overrun_drop: 0
     p0_rx_octets: 39012
     p0_tx_good_frames: 59
     p0_tx_broadcast_frames: 27
     p0_tx_multicast_frames: 17
     p0_tx_octets: 13470
     p0_tx_64B_frames: 23
     p0_tx_65_to_127B_frames: 276
     p0_tx_128_to_255B_frames: 51
     p0_tx_256_to_511B_frames: 54
     p0_tx_512_to_1023B_frames: 0
     p0_tx_1024B_frames: 0
     p0_net_octets: 52482
     p0_rx_bottom_fifo_drop: 0
     p0_rx_port_mask_drop: 0
     p0_rx_top_fifo_drop: 0
     p0_ale_rate_limit_drop: 0
     p0_ale_vid_ingress_drop: 0
     p0_ale_da_eq_sa_drop: 0
     p0_ale_block_drop: 0
     p0_ale_secure_drop: 0
     p0_ale_auth_drop: 0
     p0_ale_unknown_ucast: 0
     p0_ale_unknown_ucast_bytes: 0
     p0_ale_unknown_mcast: 0
     p0_ale_unknown_mcast_bytes: 0
     p0_ale_unknown_bcast: 0
     p0_ale_unknown_bcast_bytes: 0
     p0_ale_pol_match: 0
     p0_ale_pol_match_red: 0
     p0_ale_pol_match_yellow: 0
     p0_ale_mcast_sa_drop: 0
     p0_ale_dual_vlan_drop: 0
     p0_ale_len_err_drop: 0
     p0_ale_ip_next_hdr_drop: 0
     p0_ale_ipv4_frag_drop: 0
     p0_tx_mem_protect_err: 0
     p0_tx_pri0: 59
     p0_tx_pri1: 0
     p0_tx_pri2: 0
     p0_tx_pri3: 0
     p0_tx_pri4: 0
     p0_tx_pri5: 0
     p0_tx_pri6: 0
     p0_tx_pri7: 0
     p0_tx_pri0_bcnt: 13470
     p0_tx_pri1_bcnt: 0
     p0_tx_pri2_bcnt: 0
     p0_tx_pri3_bcnt: 0
     p0_tx_pri4_bcnt: 0
     p0_tx_pri5_bcnt: 0
     p0_tx_pri6_bcnt: 0
     p0_tx_pri7_bcnt: 0
     p0_tx_pri0_drop: 0
     p0_tx_pri1_drop: 0
     p0_tx_pri2_drop: 0
     p0_tx_pri3_drop: 0
     p0_tx_pri4_drop: 0
     p0_tx_pri5_drop: 0
     p0_tx_pri6_drop: 0
     p0_tx_pri7_drop: 0
     p0_tx_pri0_drop_bcnt: 0
     p0_tx_pri1_drop_bcnt: 0
     p0_tx_pri2_drop_bcnt: 0
     p0_tx_pri3_drop_bcnt: 0
     p0_tx_pri4_drop_bcnt: 0
     p0_tx_pri5_drop_bcnt: 0
     p0_tx_pri6_drop_bcnt: 0
     p0_tx_pri7_drop_bcnt: 0
     rx_good_frames: 70
     rx_broadcast_frames: 2
     rx_multicast_frames: 55
     rx_pause_frames: 0
     rx_crc_errors: 0
     rx_align_code_errors: 0
     rx_oversized_frames: 0
     rx_jabber_frames: 0
     rx_undersized_frames: 0
     rx_fragments: 0
     ale_drop: 46
     ale_overrun_drop: 0
     rx_octets: 14584
     tx_good_frames: 277
     tx_broadcast_frames: 2
     tx_multicast_frames: 51
     tx_pause_frames: 0
     tx_deferred_frames: 0
     tx_collision_frames: 0
     tx_single_coll_frames: 0
     tx_mult_coll_frames: 0
     tx_excessive_collisions: 0
     tx_late_collisions: 0
     rx_ipg_error: 0
     tx_carrier_sense_errors: 0
     tx_octets: 26518
     tx_64B_frames: 23
     tx_65_to_127B_frames: 241
     tx_128_to_255B_frames: 66
     tx_256_to_511B_frames: 17
     tx_512_to_1023B_frames: 0
     tx_1024B_frames: 0
     net_octets: 41102
     rx_bottom_fifo_drop: 0
     rx_port_mask_drop: 46
     rx_top_fifo_drop: 0
     ale_rate_limit_drop: 0
     ale_vid_ingress_drop: 28
     ale_da_eq_sa_drop: 0
     ale_block_drop: 0
     ale_secure_drop: 0
     ale_auth_drop: 0
     ale_unknown_ucast: 13
     ale_unknown_ucast_bytes: 1398
     ale_unknown_mcast: 55
     ale_unknown_mcast_bytes: 13058
     ale_unknown_bcast: 2
     ale_unknown_bcast_bytes: 128
     ale_pol_match: 0
     ale_pol_match_red: 0
     ale_pol_match_yellow: 0
     ale_mcast_sa_drop: 0
     ale_dual_vlan_drop: 0
     ale_len_err_drop: 0
     ale_ip_next_hdr_drop: 0
     ale_ipv4_frag_drop: 0
     iet_rx_assembly_err: 0
     iet_rx_assembly_ok: 0
     iet_rx_smd_err: 0
     iet_rx_frag: 0
     iet_tx_hold: 0
     iet_tx_frag: 0
     tx_mem_protect_err: 0
     tx_pri0: 277
     tx_pri1: 0
     tx_pri2: 0
     tx_pri3: 0
     tx_pri4: 0
     tx_pri5: 0
     tx_pri6: 0
     tx_pri7: 0
     tx_pri0_bcnt: 26518
     tx_pri1_bcnt: 0
     tx_pri2_bcnt: 0
     tx_pri3_bcnt: 0
     tx_pri4_bcnt: 0
     tx_pri5_bcnt: 0
     tx_pri6_bcnt: 0
     tx_pri7_bcnt: 0
     tx_pri0_drop: 0
     tx_pri1_drop: 0
     tx_pri2_drop: 0
     tx_pri3_drop: 0
     tx_pri4_drop: 0
     tx_pri5_drop: 0
     tx_pri6_drop: 0
     tx_pri7_drop: 0
     tx_pri0_drop_bcnt: 0
     tx_pri1_drop_bcnt: 0
     tx_pri2_drop_bcnt: 0
     tx_pri3_drop_bcnt: 0
     tx_pri4_drop_bcnt: 0
     tx_pri5_drop_bcnt: 0
     tx_pri6_drop_bcnt: 0
     tx_pri7_drop_bcnt: 0
Regards,
Tanmay
