This thread has been locked.

If you have a related question, please click the "Ask a related question" button in the top right corner. The newly created question will be automatically linked to this question.

AM6422: Can you share the example of using IEP to get the current system time in PRU

Part Number: AM6422

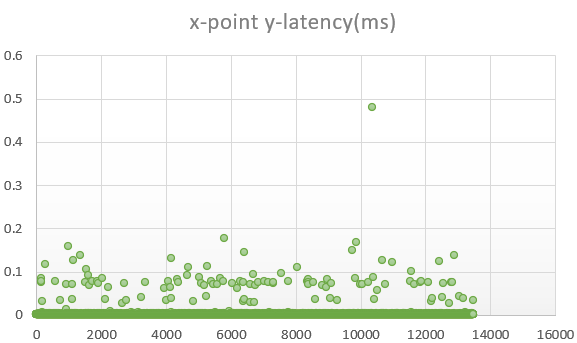
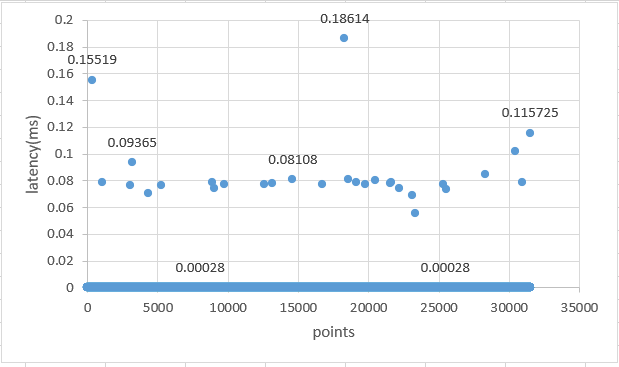
I want to test the communication latency through rpmsg between A53 and PRUs, so I want to record the timestamp when A53 sends message to PRU and the timestamp when PRU receives the message. Can you share the example of using IEP timer to get the current counter value? And how can I make sure that this IEP timer counter is synced with system time? 

  • Hello,

    Ok, there are 2 approaches you can take here.

    1: Measure round trip latency (easy)

    Round trip latency is easy to measure, because it can be done from a single core.

    e.g., to measure PRU --> A53 --> PRU, you can use the PRU CYCLE register to just count how many PRU clock cycles have passed from when the PRU sent the message, to when it receives a message:

    https://e2e.ti.com/support/processors-group/processors/f/processors-forum/1122963/am3358-how-to-use-scratch-pad-to-exchange-pru0-and-pru1/4166588#4166588

    Or, for an example of interacting with the IEP timer, reference https://git.ti.com/cgit/pru-software-support-package/pru-software-support-package/tree/examples/am335x/PRU_IEP/PRU_IEP.c 

    2: Measure one-way latency (harder)

    The reason that measuring one way latency is harder, is that you need to use the counters / clocks on two different cores. And you need to make sure that the counters are as close as possible to each other before measuring. This is not an example that TI has currently developed, and you are going to have to accept a certain amount of uncertainty in the measurements because there will be a certain amount of uncertainty in the exact difference between the counters.

    The easiest way to align the counters would probably be to use either the GTC counter to send a pulse signal to the PRU_ICSSG on a certain alignment (every second, millisecond, etc), or the CPSW CPTS GENF output to send a PPS signal to the PRU_ICSSG every second. You would want to send that signal through the Time Sync Router.

    More information about AM64x time sync router is here: https://e2e.ti.com/support/processors-group/processors/f/processors-forum/1061474/faq-am64x-what-is-the-time-sync-router-for-how-do-i-use-it

    The worst case signal latency on AM64x from an internal source, through the time sync router, to the PRU_ICSSG, is input latency + (router + output latency) = 10ns + 4ns = 14ns. So assuming you are looking for latency measurements that are accurate within the us instead of the ns, you should be fine.

    Once the IEP counter and the A53 clock are synchronized, then you could collect timestamps from both sides to capture the one-way latency.

    Regards,

    Nick

  • I just want to say thanks for your questions and interactions on the forums. You have been really helpful in driving different documentation for everyone, like the read/write latency FAQ https://e2e.ti.com/support/processors-group/processors/f/processors-forum/1096933/faq-pru-how-do-i-calculate-read-and-write-latencies

    On this side, I have only had time to try round-trip RPMsg latency measurements so far. If you do end up collecting one-way latency measurements, I would love to see your work. The concepts are applicable for not just PRU RPMsg communication, but also communication with R5F & M4F cores (after doing more complex interrupt signal routing).

    Regards,

    Nick

  • Hi Nick,

    Thanks for your quickly reply. I think I will try to measure the round trip latency first, because I'm not sure that if my PRU has the enough resources to do the TSR based on our currently usage. But if the test result is not so good, maybe I still have to measure in one-way latency.

    And by the way, did you have tested the time that reading GTC counter from RT Linux APP as we discussed in another thread before?

    Best Regards

    xixiguohx

  • Hello xixiguohx,

    Sounds good.

    Could you link to the GTC counter thread? I am no longer tracking that thread on my TODO list.

    Regards,

    Nick

  • Hello xixiguohx,

    ok, continuing the conversation that we started on the GTC thread:

    The current task is to benchmark round-trip latency. That can be measured from PRU --> A53 --> PRU, or from A53 --> PRU --> A53.

    Round-trip latency measured from the PRU (PRU --> A53 --> PRU)

    We discussed methods to measure round-trip latency from the PRU side in the previous response: https://e2e.ti.com/support/processors-group/processors/f/processors-forum/1244986/am6422-can-you-share-the-example-of-using-iep-to-get-the-current-system-time-in-pru/4707703#4707703

    Round-trip latency measured from Linux (A53 --> PRU --> A53)

    I started looking into running tests like this a couple years ago, but I never got around to actually writing code.

    Checking my notes, I was looking at using one of the PMU (Performance Monitor Unit) counters that comes in the ARM 53 core. It seems like the perf driver is probably the easiest way to reference the PMU (all the non-perf options I saw during my searching today involved direct register writes and a bunch of additional complexity).

    I have run out of time for this workday, but let me know if you learn anything interesting! One of our interns will start looking at similar profiling for A53 & R5F / A53 & M4F IPC sometime soon. If they write any useful code over the next couple of weeks, I will share it here.

    Regards,

    Nick

  • Hi Nick,

    What do you mean perf driver for PMU?

    We use RT Linux. I want to get GTC counter values at when App send rpmsg to PRU, and when PRU received the rpmsg. That means I needs to get GTC counter value in both A53 and PRU.

    I think reading GTC counter from PRU sides is stable according to https://www.ti.com/lit/an/sprace8a/sprace8a.pdf?ts=1689038361267&ref_url=https%253A%252F%252Fwww.ti.com%252Fsitesearch%252Fen-us%252Fdocs%252Funiversalsearch.tsp%253FlangPref%253Den-US%2526searchTerm%253DPRU%2Bread%2Blatency%2526nr%253D532

    So I needs to test the latency for getting GTC counter value under RT linux App. I wrote a simple driver for GTC to read the GTC counter values from user space. It uses ioctl in user space, and reads the GTC counter value in kernel and then copys to user space. I do a simple test for getting GTC counter value latency, it seems the latency is not very stable, following is my test result,

    Do you think that I'm on a right way?

    Best Regards

    xixiguohx

  • Hello xixiguohx,

    Round-trip measurements

    If you are interested in just measuring round-trip latency from the Linux A53 side, the Linux perf driver was the tool I was looking at for timestamping. You should be able to find more information about perf online.

    I would not expect perf to provide a timestamp that can be compared against a timestamp from the PRU side, since it is using a separate set of timers in the PMU instead of something like the GTC.

    One-way measurements - how to see how long the GTC reads are taking?

    It sounds like you are looking at one-way latency with the GTC timer reads.

    Perf might also be useful to timestamp how long it takes for your Linux code to read the GTC value. Something like this:
    perf timestamp1
    your code that gets the GTC counter value
    perf timestamp2

    read time is timestamp2 - timestamp1

    the next question is, "ok, how long does the perf timestamp take to happen?". I do not know the answer to that question.

    You should also measure how long the PRU takes to read the GTC timer with the PRU CYCLE register as discussed in the previous response: https://e2e.ti.com/support/processors-group/processors/f/processors-forum/1244986/am6422-can-you-share-the-example-of-using-iep-to-get-the-current-system-time-in-pru/4707703#4707703

    Regards,

    Nick

  • So in order to see if you are going in the right direction, I would:

    1) test the GTC reads from the Linux side: how long do they take on average? What is the shortest read, and what is the longest read? (probably using perf to measure that read time)

    2) test the GTC reads from the PRU side: how long do they take on average? What is the shortest read, and what is the longest read?

    3) Is that variation and that read latency within an acceptable range for you?

    especially with Linux, the more datapoints, the better. With regular Linux code (even RT Linux), it is not truly real-time, so there is always the chance that code takes longer to run than expected. I am not sure if the GTC reads that you are programming would also be non-deteministic, or if the code is small enough that it is very unlikely to be preempted by other code.

    Regards,

    Nick

  • Hi Nick,

    Thank you!

    I want to test the GTC reads latency in our APP, so maybe it's not the best choice to use perf as system call in user level APP to get timestamp.

    The average latency might be useless, the worst case(the maximum latency) is the most important parameter. In my 7h test result, the longest read took almost 0.5ms, and this is not accepted.

    So I'm still need to sync the A53 and ICSSG time. But I did not understand how to use CPTS + TSR + PRU_ICSSG to sync A53 and PRU time. The TRM does not have the details about the whole initialization and configuration example about CPTS + TSR + ICSSG. Do you have any example about this?

    Best Regards

    xixiguohx

  • Hi xixiguohx,

    I'm not TI, but we've been working on time synchronization throughout the AM64x for quite some time now.

    The GTC is used as "the system timer" on the A53 that can be read with very little overhead. It can be read from user space, too. You can read up on this in the ARMv8-A programmer's guide. You probably just need some inline assembly to read CNTPCT_EL0 or CNTVCT_EL0. Latency for that access method should be barely noticeable. You could also try mapping the GTC registers to user space via /dev/mem, at least for development, removing the kernel call from the observed latency.

    That said, 0.5ms for reading the GTC via memory mapped registers feels way too high. Something on the order of ~200ns would be more reasonable. Is there a chance that your outliers are caused by scheduling / interrupts? How exactly are you measuring that latency? Did you run that test with a sufficiently high RT priority?

    Synchronizing time via CPTS, TSR etc. is a rather complex task. I don't think there's any readily usable guidance from TI available.

    Regards,

    Dominic

  • Hey Dominic,

    Thanks for jumping on! You are right that we don't currently have an example for synchronizing time across the TSR, but I'll see what we can do here. PRU IEP should be a lot simpler to get going than R5F / M4F, just because the signal routing is a lot simpler.

    Hello xixiguohx,

    Ok. Let's assume you are synchronizing the Linux system time to an external clock source over Ethernet, and then you want to use a PPS signal from the CPTS to synchronize the Linux system time with the IEP counter. After doing an initial read of the Linux system time, then the PRU can wait on the rising or falling edge to re-sync itself every second.

    Step 1: taking a PPS signal from the CPTS and routing it somewhere

    You can actually find updated documentation as of SDK 9.0 on how to get a PPS signal to go from the CPTS and loop back to itself to generate a CPTS timestamp here: https://software-dl.ti.com/processor-sdk-linux/esd/AM64X/09_00_00_03/exports/docs/linux/Foundational_Components/Kernel/Kernel_Drivers/Network/CPSW-PTP.html

    (section "Time stamping external events" discusses how to set up the loopback, section "PPS Pulse Per Second support" discusses how to set up PPS)

    If you check the AM64x board devicetree files, you can see that that same PPS signal is also getting routed to an external SYNC_OUT pin, where it can be observed with an oscilloscope.

    Step 2: configure the time sync router to send the PPS signal to the PRU 

    Add an entry to the time sync router in the Linux devicetree that goes to one of the PRU signals. Outputs are listed in the Linux SDK sections above, or at https://e2e.ti.com/support/processors-group/processors/f/processors-forum/1061474/faq-am64x-what-is-the-time-sync-router-for-how-do-i-use-it

    Now that I am looking at this a bit closer, I am not sure where those EDCx_LATCHx_IN signals go in the PRU_ICSSG. Let me check with the HW designer.

    Step 3: configure PRU to receive the PPS signal 

    See Nick's next response for more details

    Regards,

    Nick

  • Hi Dominic,

    Thanks for your kindly reply!

    I have no idea about how to do inline assembly to read CNTPCT_EL0 or CNTVCT_EL0 in AM64x APP level, could you kindly share any example?

    You are right that my outliers could be caused by scheduling / interrupts, because I did not configure the measuring thread to a high RT priority. In my measuring thread, I use ioctl in user space to get the GTC counter values from kernel.

    Kernel:
    gtcCounter = (uint32_t)readl((uint32_t *)(pGtcBase + GTC0_CFG1_CNTCV_LO_OFFSET));
    copy_to_user((void *)arg, &gtcCounter, sizeof(gtcCounter));
    App:
    fd = open(GTC_DEV_NAME, O_RDONLY);
    ioctl(fd, GTC_CMD, &result);

    I tried to read twice of the GTC counter values, and get the value in subtraction between the two counter values to estimate the latency. 

    I will try to map the GTC registers via /dev/mem first to see if it was on the order of ~200ns.

    Hi Nick,

    Thanks! I will try to use /dev/mem first. It seems too complex for me to use CPSW-CPTS. Maybe I misunderstood your meaning, I think CPTS and CPSW-CPTS are two different instances in AM64x. Do you mean that we should use CPSW-CPTS, not CPTS to implement the time sync between A53 and ICSSG IEP?

    BR

    xixiguohx

  • Hello xixiguohx,

    CPTS instances? 

    AM64x has 3 CPTS instances: a general purpose one in the MAIN domain, one in the PCIE subsystem, and one in the CPSW subsystem (see Technical reference manual, aka TRM chapter Time Sync > Time Sync Module).

    In the example I linked above, the CPSW-CPTS is the CPTS instance that was used (you can double check against the devicetree settings:

           /* Example of the timesync routing */
               cpsw_cpts: cpsw-cpts {
                       pinctrl-single,pins = <
                               /* pps [cpsw cpts genf0] in21 -> out33 [cpsw cpts hw4_push] */
                               TS_OFFSET(33, 21)

    relates to 

    TIMESYNC_INTRTR0_IN_21  21    CPSW0_CPTS_GENF0_0

    and 

    TIMESYNC_EVENT_INTROUTER0_outl_33   CPSW0_cpts_hw4_push_IN_0

  • Step 3: Configure PRU to receive the PPS signal 

    (I'll add this information to a separate FAQ in a bit)

    These are the AM64x time sync router outputs that go to a PRU subsystem:
    https://software-dl.ti.com/tisci/esd/latest/5_soc_doc/am64x/interrupt_cfg.html#timesync-event-introuter0-interrupt-router-output-destinations

    Destination Name Destination Interface
    AM64X_DEV_PRU_ICSSG0 pr1_edc0_latch0_in
    AM64X_DEV_PRU_ICSSG0 pr1_edc0_latch1_in
    AM64X_DEV_PRU_ICSSG0 pr1_edc1_latch0_in
    AM64X_DEV_PRU_ICSSG0 pr1_edc1_latch1_in
    AM64X_DEV_PRU_ICSSG1 pr1_edc0_latch0_in
    AM64X_DEV_PRU_ICSSG1 pr1_edc0_latch1_in
    AM64X_DEV_PRU_ICSSG1 pr1_edc1_latch0_in
    AM64X_DEV_PRU_ICSSG1 pr1_edc1_latch1_in

    So each ICSSG instance has 4 inputs that come from the time sync router. Each ICSSG instance has 2 IEP timers, and each IEP timer has two EDC latch inputs. Thus, pr1_edc0_latch[0:1]_in goes to IEP0, and pr1_edc1_latch[0:1]_in goes to IEP1.

    Those 4 signals are mapped to these Capture input registers, as per TRM table "IEP Timer Mode Mapping"

    To configure the IEP timer to capture these latch inputs, follow the steps in TRM section "PRU_ICSSG IEP Timer Basic Programming Sequence" > "Capture function".

    Ok, so now we have the inputs to the PRU. When a rising or falling edge is detected, the IEP capture register will contain the IEP timestamp from when that edge was detected, and the global capture event will be triggered in the PRU INTC. But which event will be the one to get triggered?

    Reference TRM section "PRU_ICSSG Interrupt Requests Mapping"

    Event #56 pr0_iep1_any_cmp_cap_pend the global capture event from IEP1
    Event #7 pr0_iep_tim_cap_cmp_pend the global capture event from IEP0

    Since the PPS signal is expected to come once a second, the PRU core can measure the difference between the IEP capture timestamp and the expected time, and then adjust the IEP counter accordingly.

    Regards,

    Nick

  • Hi Nick,

    Thanks! Yes, AM64x has 3 CPTS instances, this I understood. I mean that we can not use CPTS to do sync, only can use CPSW-CPTS to do it, is this right? If so, why can not use CPTS to do it without any network protocol? Thanks again!

    BR

    xixiguohx

  • Hello xixiguohx,

    You should theoretically be able to use either the CPTS in main domain, or the CPTS in the CPSW peripheral.

    In the example above, the Linux PTP driver is used to synchronize the CPSW - CPTS with the Linux system time. There may be other Linux drivers that can do the same thing with the main domain CPTS peripheral, I just have not looked at that usecase at this point in time.

    Regards,

    Nick

  • For future readers, the first draft of the FAQ I mentioned above is here: e2e.ti.com/.../faq-am6442-how-to-synchronize-the-pru-iep-timer-with-linux-system-time

  • Hi Dominic and Nick,

    I was blocked by other tasks for a few weeks. I tried to get GTC through /dev/mem. Most of the time, the latency was around 280ns, but stll somtimes it was almost 0.2ms. And this time I set the test program priority to 79 by cmd 'chrt -pf 79 pid', other tasks' PRI were lower than this one. Did once of the latency test every second. Below is my test results for almost 8h,

    Do you think this is reasonable? And later maybe I will try to read PRU cycle through /dev/mem, and to see if I will get the similar result.

    Best Regards

    xixiguohx

  • Hello xixiguohx,

    I believe the ~200us outliers are most likely due do interrupts/scheduling.

    Are you using a "normal" kernel or an RT-kernel?

    To rule out any effects from accessing the GTC via the SoC bus you could try reading the counter directly, see the function get_cntvct_el0() in that code on GitHub for an example (just a quick google result - I don't know that code otherwise): https://github.com/ARM-software/synchronization-benchmarks/blob/master/benchmarks/lockhammer/include/perf_timer.h

    If you want to reduce scheduling issues you could try core isolation, see this thread for some additional information on realtime performance: https://e2e.ti.com/support/processors-group/processors/f/processors-forum/1172055/faq-am625-how-to-measure-interrupt-latency-on-multicore-sitara-devices-using-cyclictest

    Regards,

    Dominic

  • Hi Dominic,

    I'm using an RT-kernel. I will try to do the cyclic test to check the realtime performance, and later I will post the result here. Thank you!

    Best Regards

    xixiguohx

  • Hi Nick,

    I used /dev/mem to read about the ICSSG_PRU_CYCLE, but found that when it reaches 0xFFFFFFFF, it stopped and ICSSG_PRU_CONTROL bit[3] COUNTER_ENABLE was cleared. Is there any configure that can let ICSSG_PRU_CYCLE restart counting automatically?

    Best Regards

    xixiguohx

  • Hello xixiguohx,

    I would only use the PRU_CYCLE register to time specific local events (e.g., if you need to know how many clock cycles it takes to get through a specific function, or if you were timing round-trip IPC latency). I would use the IEP timer for general timing needs, including having a free running counter that can handle numbers larger than 32 bits.

    Regards,

    Nick

  • Hi Nick,

    Actually, I want to use it to calculate the latency between A53 and PRU. I want to record the PRU_CYCLE value through /dev/mem, and when PRU receive the message record the PRU_CYCLE, then calculate the latency. But now seems not work because of PRU_CYCLE can not restart automatically, maybe I can restart the PRU_CYCLE everytime when doing the test. I'm still continue finding how to test the one-way latency with any simpler methods. If you have any updates on this topic, please let me know, thank you!

    Best Regards

    xixiguohx

  • Hello xixiguohx,

    Understood. So you'll still have the uncertainty of the time for the A53 to read the PRU counter value, but as long as the Linux function does not get preempted between the PRU counter value read and sending the RPMsg, that is the only uncertainty you would be dealing with.

    Off the top of my head, I am not aware of a way to make PRU_CYCLE restart automatically. So if you want to use that counter instead of an IEP timer, I would do what you suggested:

    1) Just restart the PRU_CYCLE counter every time the PRU receives an RPMsg

    2) discard the very first Linux PRU_CYCLE read for the very first RPMsg sent in a test run, since it will have the potential for being stopped (e.g., if you are doing 1 million tests, discard just the very first test)

    Regards,

    Nick

  • Hi Dominic and Nick,

    I did the cyclictest with my APP running. I have RT threads(SCHED_FIFO) with PRI 89, PRI 88, PRI 87 and other RT threads with PRI smaller than PRI 82. I run cyclictest with below command(I want to test this thread on CPU1 with PRI 82),

    cyclictest -t1 -a1 -l200000000 -m -p82 --policy=fifo -i200 -h1000 -q

    The result is,

    # Total: 199999999
    # Min Latencies: 00005
    # Avg Latencies: 00055
    # Max Latencies: 01033
    # Histogram Overflows: 00001
    # Histogram Overflow at cycle number:
    # Thread 0: 110887913

    The result shows that the worst latency is 1.033ms. 

    Do you have any comments or test suggestions?

    Best Regards

    xixiguohx

  • I have RT threads(SCHED_FIFO) with PRI 89, PRI 88, PRI 87 and other RT threads with PRI smaller than PRI 82

    This is completely dependent on what your threads at 87, 88, 89 are doing, as they will not be preempted by cyclictest running at 82. So this is not worst case interrupt latency, but what is left for the 4th priority in your system.

  • Hi Pekka,

    I agree with you, this should be my 4th priority thread's performance. So if I want to optimize this 4th priority thread's performance, I should break down the tasks of the higher priority threads as smaller as possible.

    Do you have any other suggestions that can help to evaluate the performance of different priority threads in the system?

    Thanks!

    Best Regards

    xixiguohx

  • Run cyclictest at 90 to see what would it's worst case be if you had not prioritized your 3 other threads higher. The delta between the 82 and 90 runs should point out how much of the latency comes from your 3 application threads. https://software-dl.ti.com/processor-sdk-linux/esd/AM64X/latest/exports/docs/devices/AM64X/RT_Linux_Performance_Guide.html#stress-ng-and-cyclic-test is a in 9.0 SDK (9.0 behaves much better than older 8.x SDKs), so the system is likely contributing ~100-150us, so I'd expect your 3 threads to be the cause for majority of the latency.

    This thread has diverged quite a lot from a IEP reading question to generic Linux PREEMPT_RT latency measurements. I'd suggest to close the IEP reading question, assuming you have an answer to that. 

  • Hi Pekka,

    Thanks, I will do the cyclictest at 90 to check the worst case of the RT-linux system, and put the results here.

    Best Regards

    xixiguohx

  • Hello xixiguohx,

    I wanted to check on your usecase here. Are you trying to benchmark the latency for RPMsg between Linux and the PRU cores because your usecase requires that the latency must always be below a certain threshold? If so, could you tell me more a bit more about the usecase, either here or in a direct message?

    I am asking because it looks like we do not currently have a good way to raise the relative priority of the RPMsg thread in an RT Linux system, which can lead to occasional large latencies if other tasks get prioritized first. For more on that discussion, refer to https://e2e.ti.com/support/processors-group/processors/f/processors-forum/1248887/tmds64evm-a-way-to-achive-data-transer-of-1500-bytes-in-1-millisecond-from-a53-to-r5f-and-back

    I am talking with the development team about looking into our options with RPMsg <--> M4F & R5F, but we have not brought up PRU yet. If that is important to your usecase, I can add it to our internal discussion.

    Regards,

    Nick

  • Hi Nick,

    I'm sorry for the late reply, I was on holiday last week. 

    "Are you trying to benchmark the latency for RPMsg between Linux and the PRU cores because your usecase requires that the latency must always be below a certain threshold?"

    Yes, we want that latency always be below a certain threshold. 

    I'm investigating how to configure the RPMsg thread and IRQs priority and affinity too. It's really important to our usecase, please add it to your discussion.

    Best Regards

    xixiguohx

  • Hi Xixiguohx,

    Our PRU expert is out of office until end of October. Please expect delayed response.

  • Hello xixiguohx,

    Thank you for letting me know. As far as I can tell without having run one-way tests myself, it is the remote core --> Linux path that can sometimes get deprioritized. So far, I have not heard anything about rare latency spikes for IPC going from Linux to the remote core.

    Do you need any additional discussion on subjects like thread priority? Any other things you want to discuss?

    Regards,

    Nick

  • Hello Nick,

    Thank you. Yes, I need additional discussion about how to set the IRQ affinity and the IRQ thread priority. 

    Does there any way to set the rpmsg IRQs affinity, and the GPIO IRQs affinity?

    Below is parts of the result of `cat /proc/interrupts` on my board,

    345: 0 0 GPIO 6 Edge -davinci_gpio matrix-keypad
    351: 0 0 GPIO 12 Edge -davinci_gpio matrix-keypad
    353: 0 0 GPIO 14 Edge -davinci_gpio matrix-keypad
    354: 0 0 GPIO 15 Edge -davinci_gpio matrix-keypad

    600: 2 0 pruss-intc 20 Level remoteproc9 
    602: 1 0 pruss-intc 18 Level remoteproc11

    I used rt SDK8.6.

    BR

    xixiguohx

  • Hello xixiguohx,

    I started looking into setting the RT priority, but I ran out of time today. I am posting the information I have so far, just in case it is helpful for you:

    raising the priority of ksoftirqs and the application that you want to run:

    Use chrt to change the priority of a thread. E.g.,

    #in RT linux to make the networking related kernel services run at higher priority, increases throughput in no packet loss case

    ps aux | grep ksoftirq

    chrt -f -p 10 13

    chrt -f -p 10 27


    And then raise the priority of the application, like this:

    chrt 9 iperf3 -u -t 0 -b 600M -c 192.168.1.106 -l 1000 -p 5201

    #this sets a priority of 9 on iperf3 -s, and 10 for the ksoftirq's

    Other useful stuff 

    https://www.linutronix.de/blog/A-Checklist-for-Real-Time-Applications-in-Linux

    Regards,

    Nick

  • Hi Nick,

    Thanks Nick, chrt works well after the system startup. I used rpmsg between PRU and A53, so is there any methods that can set the rpmsg interrupt IRQ thread priority at the time that thread is created?

    Best Regards

    xixiguohx

  • Hello xixiguohx,

    I will ask around to see if any of my team members are familiar with raising the priority of specific threads in an "end application" usecase instead of the  debugging usecase shown above, where you need to manually check which PID is which. However, this is starting to get outside the realm of TI-related questions that we can help with on the forums, and enter more into "generic Linux" questions that we cannot really support here.

    Regards,

    Nick

  • https://man7.org/linux/man-pages/man2/sched_setscheduler.2.html was suggested as something you could look into.

    Regards,

    Nick

  • Hi Nick,

    Ok, thanks Nick. I will check when is the rpmsg IRQ thread created in kernel.

    Best Regards

    xixiguohx