Hi,
The link to the previous question:
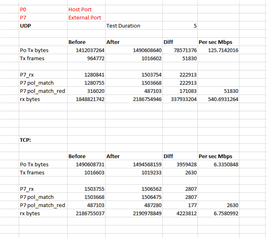
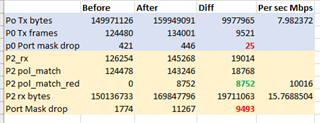
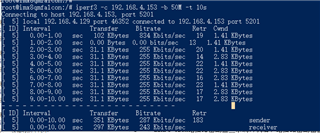
After policer 0 and policer 1 are added, only packets that satisfy policer 0 are sent to linux (A72). However, rate limiting via pir and cir did not work as well as expected. The value of pir is 20000000 (20Mbps) and cir is 10000000(10Mbps).
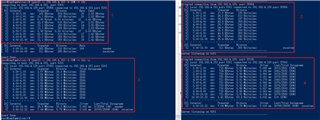
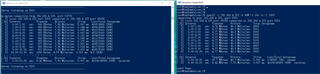
[MCU2_0] 18774.190795 s: Function:CpswProxyServer_switch_tool_list_policer_helper,HostId:0,Handle:a32069fc,CoreKey:38acb7e6
[MCU2_0] 18774.190859 s: src/mod/cpsw_ale.c line[3805]:
[MCU2_0] 18774.190909 s: src/mod/cpsw_ale.c line[3915]: 0: Vlanid: 000a, UTagged: 1ff, Mult: 1ff, UMult: 0, Member: 1ff
[MCU2_0] 18774.190958 s: src/mod/cpsw_ale.c line[4051]: RAW:[0 200a1f
[MCU2_0] 18774.190990 s: src/mod/cpsw_ale.c line[4056]: f1 ff0001ff]
[MCU2_0] 18774.191032 s: src/mod/cpsw_ale.c line[3915]: 1: Vlanid: 0190, UTagged: 1ff, Mult: 1ff, UMult: 0, Member: 1ff
[MCU2_0] 18774.191078 s: src/mod/cpsw_ale.c line[4051]: RAW:[0 21901f
[MCU2_0] 18774.191109 s: src/mod/cpsw_ale.c line[4056]: f1 ff0001ff]
[MCU2_0] 18774.191149 s: src/mod/cpsw_ale.c line[3915]: 2: Vlanid: 0191, UTagged: 1ff, Mult: 1ff, UMult: 0, Member: 1ff
[MCU2_0] 18774.191194 s: src/mod/cpsw_ale.c line[4051]: RAW:[0 21911f
[MCU2_0] 18774.191225 s: src/mod/cpsw_ale.c line[4056]: f1 ff0001ff]
[MCU2_0] 18774.191265 s: src/mod/cpsw_ale.c line[3915]: 3: Vlanid: 0193, UTagged: 1ff, Mult: 1ff, UMult: 0, Member: 1ff
[MCU2_0] 18774.191337 s: src/mod/cpsw_ale.c line[4051]: RAW:[0 21931f
[MCU2_0] 18774.191373 s: src/mod/cpsw_ale.c line[4056]: f1 ff0001ff]
[MCU2_0] 18774.191415 s: src/mod/cpsw_ale.c line[3915]: 4: Vlanid: 0194, UTagged: 1ff, Mult: 1ff, UMult: 0, Member: 1ff
[MCU2_0] 18774.191461 s: src/mod/cpsw_ale.c line[4051]: RAW:[0 21941f
[MCU2_0] 18774.191492 s: src/mod/cpsw_ale.c line[4056]: f1 ff0001ff]
[MCU2_0] 18774.191531 s: src/mod/cpsw_ale.c line[3915]: 5: Vlanid: 0195, UTagged: 1ff, Mult: 1ff, UMult: 0, Member: 1ff
[MCU2_0] 18774.191576 s: src/mod/cpsw_ale.c line[4051]: RAW:[0 21951f
[MCU2_0] 18774.191607 s: src/mod/cpsw_ale.c line[4056]: f1 ff0001ff]
[MCU2_0] 18774.191647 s: src/mod/cpsw_ale.c line[3915]: 6: Vlanid: 0196, UTagged: 1ff, Mult: 1ff, UMult: 0, Member: 1ff
[MCU2_0] 18774.191692 s: src/mod/cpsw_ale.c line[4051]: RAW:[0 21961f
[MCU2_0] 18774.191723 s: src/mod/cpsw_ale.c line[4056]: f1 ff0001ff]
[MCU2_0] 18774.191763 s: src/mod/cpsw_ale.c line[3915]: 7: Vlanid: 0197, UTagged: 1ff, Mult: 1ff, UMult: 0, Member: 1ff
[MCU2_0] 18774.191808 s: src/mod/cpsw_ale.c line[4051]: RAW:[0 21971f
[MCU2_0] 18774.191839 s: src/mod/cpsw_ale.c line[4056]: f1 ff0001ff]
[MCU2_0] 18774.191887 s: src/mod/cpsw_ale.c line[3849]: 8: Address: ffffffffffff, Member:1ff Su=0 FWDSTLVL=0 IGNMBITS=0
[MCU2_0] 18774.191933 s: src/mod/cpsw_ale.c line[4051]: RAW:[c 1000ff
[MCU2_0] 18774.191963 s: src/mod/cpsw_ale.c line[4056]: ff ffffffff]
[MCU2_0] 18774.192013 s: src/mod/cpsw_ale.c line[3870]: 9: Address: 48495241a19a, Port: 000 Se=1 Bl=0 TOUCH=0 AGE=0 TRUNK=0
[MCU2_0] 18774.192060 s: src/mod/cpsw_ale.c line[4051]: RAW:[1 100048
[MCU2_0] 18774.192091 s: src/mod/cpsw_ale.c line[4056]: 49 5241a19a]
[MCU2_0] 18774.192138 s: src/mod/cpsw_ale.c line[3870]: 10: Address: 484952411081, Port: 003 Se=0 Bl=0 TOUCH=0 AGE=0 TRUNK=0
[MCU2_0] 18774.192184 s: src/mod/cpsw_ale.c line[4051]: RAW:[c 100048
[MCU2_0] 18774.192215 s: src/mod/cpsw_ale.c line[4056]: 49 52411081]
[MCU2_0] 18774.192261 s: src/mod/cpsw_ale.c line[3870]: 11: Address: 48495241a199, Port: 000 Se=0 Bl=0 TOUCH=0 AGE=0 TRUNK=0
[MCU2_0] 18774.192326 s: src/mod/cpsw_ale.c line[4051]: RAW:[0 100048
[MCU2_0] 18774.192359 s: src/mod/cpsw_ale.c line[4056]: 49 5241a199]
[MCU2_0] 18774.192400 s: src/mod/cpsw_ale.c line[3939]: 12: IPv4: Address: 192:168:04:129, IGNBITS:0
[MCU2_0] 18774.192441 s: src/mod/cpsw_ale.c line[4051]: RAW:[1 a00000
[MCU2_0] 18774.192473 s: src/mod/cpsw_ale.c line[4056]: 00 c0a80481]
[MCU2_0] 18774.192513 s: src/mod/cpsw_ale.c line[3939]: 13: IPv4: Address: 192:168:04:153, IGNBITS:0
[MCU2_0] 18774.192553 s: src/mod/cpsw_ale.c line[4051]: RAW:[1 a00000
[MCU2_0] 18774.192584 s: src/mod/cpsw_ale.c line[4056]: 00 c0a80499]
[MCU2_0] 18774.192625 s: src/mod/cpsw_ale.c line[3915]: 14: Vlanid: 0004, UTagged: 0, Mult: 9, UMult: 9, Member: 9
[MCU2_0] 18774.192668 s: src/mod/cpsw_ale.c line[4051]: RAW:[0 200400
[MCU2_0] 18774.192699 s: src/mod/cpsw_ale.c line[4056]: 90 00009009]
[MCU2_0] 18774.192770 s: src/mod/cpsw_ale.c line[3870]: 32: Address: 484952412083, Port: 003 Se=0 Bl=0 TOUCH=1 AGE=1 TRUNK=0
[MCU2_0] 18774.192816 s: src/mod/cpsw_ale.c line[4051]: RAW:[c d00a48
[MCU2_0] 18774.192847 s: src/mod/cpsw_ale.c line[4056]: 49 52412083]
[MCU2_0] 18774.194240 s: src/mod/cpsw_ale.c line[4061]:
[MCU2_0] 18774.194268 s: src/mod/cpsw_ale.c line[4062]: 1008 Free Entries
[MCU2_0] 18774.194315 s: src/mod/cpsw_ale.c line[5603]:
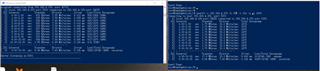
[MCU2_0] 18774.194348 s: src/mod/cpsw_ale.c line[5624]: 0: POLICER_PORT, PORT_NUM: 3 ISTRUNK:0
[MCU2_0] 18774.194388 s: src/mod/cpsw_ale.c line[5642]: 0: POLICER_DST_MAC,ALE Index: 11
[MCU2_0] 18774.194424 s: src/mod/cpsw_ale.c line[5648]: 0: POLICER_SRC_MAC,ALE Index: 10
[MCU2_0] 18774.194460 s: src/mod/cpsw_ale.c line[5672]: 0: POLICER_SRC_IP,ALE Index: 12
[MCU2_0] 18774.194496 s: src/mod/cpsw_ale.c line[5678]: 0: POLICER_DST_IP,ALE Index: 13
[MCU2_0] 18774.194531 s: src/mod/cpsw_ale.c line[5684]: 0: POLICER_THREAD,THREAD ID:0
[MCU2_0] 18774.194566 s: src/mod/cpsw_ale.c line[5692]: 0: POLICER_PIR_IDL_INC_VAL: 2048
[MCU2_0] 18774.194602 s: src/mod/cpsw_ale.c line[5701]: 0: POLICER_CIR_IDL_INC_VAL: 1024
[MCU2_0] 18774.194646 s: src/mod/cpsw_ale.c line[5729]: 0: POLICER_STATS: Hit: 1, RedHit: 1, YellowHit: 1
[MCU2_0] 18774.194692 s: src/mod/cpsw_ale.c line[5624]: 1: POLICER_PORT, PORT_NUM: 0 ISTRUNK:0
[MCU2_0] 18774.194733 s: src/mod/cpsw_ale.c line[5729]: 1: POLICER_STATS: Hit: 1, RedHit: 0, YellowHit: 0
[MCU2_0] 18774.194972 s: src/mod/cpsw_ale.c line[5733]:
[MCU2_0] 18774.194997 s: src/mod/cpsw_ale.c line[5734]: 94 Free Entries
…
policerEn: 1, yellowDropEn: 1, redDropEn: 1, yellowThress: 0, policerNoMatchMode: 0, noMatchPolicer: -1558156804
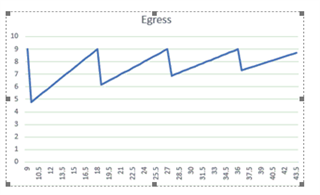
The test result:
Best Regards,
Ruijie