Part Number: AM6442
Other Parts Discussed in Thread: SK-AM64B, , AM6422, DRA821U
Tool/software:
Dear Experts,
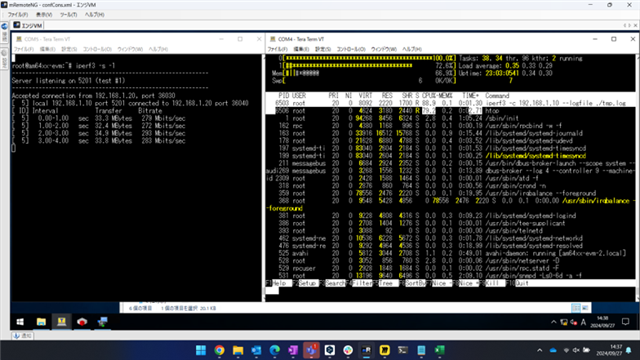
The PRP throughput was measured by connecting two SK-AM64Bs in opposition to each other.
The measured throughput for client-server communication of iperf was approximately 300Mbps.
-The two Ethernet ports on the board are connected to the ports of the communication partner without an L2SW in between.
-The PRP stack implemented in the Linux driver was used in NON-offload mode for PRP.
The SDK used was 09.02.01.09 (29 Mar 2024).
-In a normal single-cable connection without PRP, the throughput is over 800Mbps.
So here are my questions.Please answer as much as possible.
Is the PRP throughput of 300Mbps for the SK-AM64B reasonable?
1)Is there an error in the way I'm using the PRP?
Is the interface speed supported by the PRP correct at 1Gbps? Or is it 100Mbps?
Does the PRP in the SDK I used implement the IEC 62439-3 Edition 3 standard?
2)How can I increase the throughput?
If I use two PC-Linux instead of SK-AM64B, the throughput of PRP is 1Gbps.
Will updating to the latest SDK 10.00.07.04 (14 Aug 2024) improve it?
Are there any tuning items?
3)Is this the limit of performance in non-offload mode?
When will the PRP offload modules (firmware) for PRU-ICSSG and CPSW3g be completed?
When will the Linux drivers for these offload modules be provided?
Thank you in advance
Regards,
Takeshi OHNO