A related question is a question created from another question. When the related question is created, it will be automatically linked to the original question.
If you have a related question, please click the "Ask a related question" button in the top right corner. The newly created question will be automatically linked to this question.
The TOP and HTOP mechanisms are considering 100% to be full utilization of 1 core. Excess of 100% means that multiple CPU cores are being used. In your case, all 4 cores are being used.
This means at least 4 threads are being used. This is likely the default for ONNXRuntime, which by default uses the number of CPU cores
This may boost best-case performance, but I think worst and average case performance will suffer if any other process or thread needs to interrupt on any core. It would therefore the delay the whole model
I recommend checking how many CPU threads are being enabled for ONNXRuntime
Would you please use the perf_stats tool to measure your system utilization and share the results? Please share two measurements, one before running your model and another one while you are running inference on the model.
The perf_stats tool in part of the edgeai-gst-apps project. The code and instructions to build and run are here: github.com/.../perf_stats
We have provided the source code and pointed out that any artifact model can be used, and this problem is easy to reproduce. Would you please run it and try to debug and solve this problem.This may be more efficient and will not waste too much time.
I've taken your file and (with modifications) run this, using /opt/model_zoo/ONR-CL-6360-regNetx-200mf as the model to test. Allow me to detail my observations. I have reproduced your error partially, but not fully.
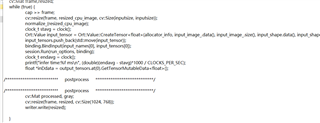
I tested this first without using live-streamed frames from USB camera, where the core loop looks like the following:
                //avoid capture, resize, new assignment for input data
                //cap >> frame;
                //cv::resize(frame, resized_cpu_image, cv::Size(inputsize, inputsize));
                //input_image_2.assign(resized_cpu_image.data, resized_cpu_image.data + resized_cpu_image.total()*resized_cpu_image.channels());

                //normalize_(resized_cpu_image);
                //modified for uint8_t, since our artifacts take uint8 in, not float. Also removes need to normalize.
                Ort::Value input_tensor = Ort::Value::CreateTensor<uint8_t>(allocator_info, input_image_2.data(), input_image_2.size(), input_shape.data(), input_shape.size());
                input_tensors.push_back(std::move(input_tensor));
                binding.BindInput(input_names[0], input_tensors[0]);
                clock_t stavg = clock();
                session.Run(run_options, binding);
                clock_t endavg = clock();
                printf("infer time:%f ms\n", (double)(endavg - stavg)*1000 / CLOCKS_PER_SEC);
                float *inDdata = output_tensors.at(0).GetTensorMutableData<float>();

/****************************     postprocess     *******************************/
                //no postproc
/****************************     postprocess     *******************************/
                cv::Mat processed, gray;
                //Avoid resize and push to output
                //cv::resize(frame, resized, cv::Size(1024, 768));
                //writer.write(resized);
And I moved timestamps to be before and after just the inference call itself, not any of the other API calls
I'm not able to replicate the extremely high CPU loading. I see about 15% average CPU load (none higher than 25% on a single core), and this increases to average 40% when I also include input capture from camera + display output. No preprocessing is necessary in my model, and I suspect the normalization in yours is adding further load. I see variance in the measured latency, but have some doubts here (read further)
I notice you are using the ctime 'clock' API. This measures user-level time. When TIDL is running, the user-level thread is waiting for an interrupt to return from the C7x core -- the thread is blocked, and should not be accumulating user time in the first place.
I see the measured 'clock' time in my setup is actually less than the inference time reported by TIDL (options->debug_level=1 will print cycle counts). This is only explainable by the ctime API not measuring time that is blocked until an interrupt arrives.
I do also see variability in the reported runtime latency, but I cannot trust the 'clock' API to measure the time here. It needs to use a global system timer, not user time.
Variability seems to be correlated with the complexity of the inner loop here (capture, display, input normalization). I am not entirely sure the root cause of inference time variability here.
Let me come back to this tomorrow / the coming days. First step needs to be using a global timer instead of user-clock.
I notice you are using the ctime 'clock' API. This measures user-level time. When TIDL is running, the user-level thread is waiting for an interrupt to return from the C7x core -- the thread is blocked, and should not be accumulating user time in the first place.
I have confirmed this, see the code snippet here:
                auto begin = chrono::high_resolution_clock::now();    //new
                clock_t stavg = clock(); //original
                session.Run(run_options, binding);
                clock_t endavg = clock(); //original
                auto end = chrono::high_resolution_clock::now();    //new

                auto dur = end - begin;
                auto us = std::chrono::duration_cast<std::chrono::microseconds>(dur).count();
                printf("(user time) infer time:%f ms\n", (double)(endavg - stavg)*1000 / CLOCKS_PER_SEC);
                printf("(system time) infer time:%ld us\n", us);
                float *inDdata = output_tensors.at(0).GetTensorMutableData<float>();

//must #include <chrono>
The result matches my expectation -- measuring with wall-clock time shows consistent runtime (for regnet-200mf model, that was between 4.9 and 5.0 ms), with little variance, whereas the times resulting from clock() had a larger degree of variation.
With all the surrounding preprocessing code, I still see CPU utilization up to 40% per core, on average. Most of the multi-thread/process here should be a result of gstreamer / CV capture
From what I see in your previous thread, it seems you are experiencing higher CPU load and variable inference latency. Did you measure that as well with the clock() API? I suggest revisiting that. Beyond that, perhaps your model is running some operations on CPU? Your resolution was small (128x128x3) so preprocessing should not be a huge load.