J784S4XEVM: Performance gap on MLPerf models

Part Number: J784S4XEVM
Other Parts Discussed in Thread: TDA4VM, SK-AM69, TDA4VH

Hi,

I have inferred the MLPerf models mentioned in TDA4VH-Q1: Model IDs used for MLPerf Benchmarking - Processors forum - Processors - TI E2E support forums on the J784S4 EVM with following methodology:

  • cloned and set up edgeai-tidlrunner repository branch r11.2 on the host pc
  • compiled the models on the host pc with the tidlrunner-cli compile command 
  • copied the compiled artifacts and datasets to the target with scp
  • cloned and set up edgeai-tidlrunner repository branch r11.2 on the target
  • inferred the models on the target with the tidlrunner-cli infer --display_benchmark command

The target is running PSDK Linux 11.02.00.04 and PSDK RTOS 11.02.00.06.

I got following benchmark results, where the reference TDA4VM performance comes from the TI application notes SPRACZ2 and SPRY344A. The FPS value is based on the Inference Latency (core runtime) result from the tidlrunner-cli infer command.

Model ID TI TDA4VM (fps) J784S4XG01 EVM (fps) Performance Delta SK-AM69 (fps)

CL-0160

162 150 -8% 113
OD-2000 385 260 -33% 254
CL-0000 741 474 -36% 451


The result of the CL-0160 model is fairly close to the benchmark, but for the other two models, there is a significant performance gap (33 and 36%). Results were consistent over a larger number of inferred frames and after power cycling the EVM.

Additionally, the benchmarking was also performed on the SK-AM69 running PSDK Linux 11.00.00.08 and PSDK RTOS 11.00.00.06. On this board, it was needed to update the target to match the TIDL Tools framework version 11.02.13.00. The benchmark results are consistent with the J784S4 EVM, except for the CL-0160 model, which is also quite bad on the SK-AM69.

Would you have any idea what could cause the performance gap on the J784S4 EVM? Are there any missing tidlrunner-cli command arguments which could explain this?

Kind regards,

Christophe

  • Hi,

    I will try it at my end and update here.

    Regards,
    Vaibhav

  • Hi Vaibhav,

    Thank you, looking forward to your feedback.

    In the meanwhile, I have used the Model Selection tool in Edge AI Studio to dive deeper into the benchmark results of TI.

    First observation, there is no data on the OD-2000 model, which is weird because it is explicitly used for advertising the SoC performance in the application notes.

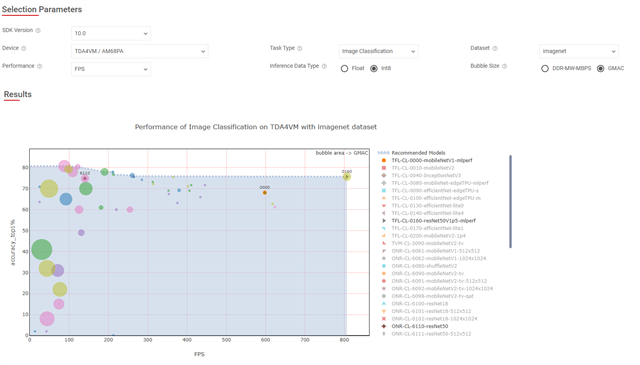
    Second observation, for the Image Classification, the listed performance for CL-0160 seems very excessive in the TDA4VM chart. 807 fps versus the 162 fps in the application notes. See the screenshot below with the 0160 data point. So, this data point seems unusable for comparison.


    Third observation, the CL-0000 model shows 598 fps, which is 19% less than the 741 fps in the application notes. I am seeing a similar result in the TDA4VH data set in the Model Selection tool, i.e., 567 vs 741 fps.

    Based on the only usable data point for comparison, CL-0000, my conclusion would therefore be that the application notes are overly optimistic, roughly overestimating the performance with 20%. Nevertheless, it would still be very useful to know where the additional performance gap with the TIDL Runner benchmark originates from.

    Kind regards,

    Christophe

  • Hi,

    I tried estimating model performance using https://github.com/TexasInstruments/edgeai-tidl-tools/blob/11_02_04_00/runtimes/examples/python/basic_example/basic_example.py, this script also provides time estimates.

    I got approximately cl-0160(164 fps), od-2000(130 fps), cl-0000 (556 fps). For me, cl-0160 is giving performance similar to application note but od-2000 and cl-0000 is degraded. But i wonder that you got 260 fps for od-2000, did you do anything different? can you share your compilation parameters or artifacts ?

    About the edgeai-studio,

    1. od-2000 do have a mention in 10.1 sdk in tda4vm with 317 fps which i am not sure right now how to get/measure 317 fps
    2. cl-0160 in 10.1 is mentioned around 160 fps which is similar to ours (but different from application note) whereas 10.0 mentioned 807 fps which looks suspicious
    3. cl-0000 is 600 fps in both 10.1 and 10.2 which is similar to ours but different from application note.

    I will further discuss with team internally about method used to estimate fps.

    Regards,
    Vaibhav

  • Hi Vaibhav,

    Thank you for your early feedback. I will try with basic_example.py as well.

    For the od-2000 model, I have compiled on the host pc with the following command:

    tidlrunner-cli compile --config_path data/configs/modelzoo/models/vision/detection/coco/mlperf/ssd_mobilenet_v1_coco_20180128_config.yaml --target_device TDA4VH

    And inferred on the J784S4 EVM with following command:

    tidlrunner-cli infer --config_path data/configs/modelzoo/models/vision/detection/coco/mlperf/ssd_mobilenet_v1_coco_20180128_config.yaml --target_device TDA4VH --display_benchmark --num_frames 1000


    The config file is the standard file from the TIDL framework. I have attached it with .txt extension, together the compilation artifacts.

    task_type: detection
    input_dataset: coco
    preprocess:
      resize:
      - 300
      - 300
      crop:
      - 300
      - 300
      data_layout: NHWC
      reverse_channels: false
      backend: cv2
      interpolation: null
      resize_with_pad: false
      pad_color: 0
      name: image_preprocess
    session:
      input_optimization: true
      input_data_layout: NHWC
      input_mean:
      - 128.0
      - 128.0
      - 128.0
      input_scale:
      - 0.007812
      - 0.007812
      - 0.007812
      runtime_options:
        advanced_options:output_feature_16bit_names_list: ''
        advanced_options:params_16bit_names_list: ''
      model_path: ssd_mobilenet_v1_coco_20180128.tflite
      model_id: od-2000
      input_details: null
      output_details: null
      num_inputs: 1
    postprocess:
      reshape_list: null
      formatter:
        src_indices:
        - 1
        - 0
        - 3
        - 2
        dst_indices:
        - 0
        - 1
        - 2
        - 3
        name: DetectionYXYX2XYXY
      resize_with_pad: false
      normalized_detections: true
      shuffle_indices: null
      squeeze_axis: 0
      ignore_index: null
      logits_bbox_to_bbox_ls: false
      keypoint: false
      object6dpose: false
      name: detection_postprocess
    metric:
      label_offset_pred:
        0: 1
        1: 2
        2: 3
        3: 4
        4: 5
        5: 6
        6: 7
        7: 8
        8: 9
        9: 10
        10: 11
        11: 12
        12: 13
        13: 14
        14: 15
        15: 16
        16: 17
        17: 18
        18: 19
        19: 20
        20: 21
        21: 22
        22: 23
        23: 24
        24: 25
        25: 26
        26: 27
        27: 28
        28: 29
        29: 30
        30: 31
        31: 32
        32: 33
        33: 34
        34: 35
        35: 36
        36: 37
        37: 38
        38: 39
        39: 40
        40: 41
        41: 42
        42: 43
        43: 44
        44: 45
        45: 46
        46: 47
        47: 48
        48: 49
        49: 50
        50: 51
        51: 52
        52: 53
        53: 54
        54: 55
        55: 56
        56: 57
        57: 58
        58: 59
        59: 60
        60: 61
        61: 62
        62: 63
        63: 64
        64: 65
        65: 66
        66: 67
        67: 68
        68: 69
        69: 70
        70: 71
        71: 72
        72: 73
        73: 74
        74: 75
        75: 76
        76: 77
        77: 78
        78: 79
        79: 80
        80: 81
        81: 82
        82: 83
        83: 84
        84: 85
        85: 86
        86: 87
        87: 88
        88: 89
        89: 90
        -1: 0
        90: 91
    model_info:
      metric_reference:
        accuracy_ap[.5:.95]%: 23.0
      model_shortlist: 30
      compact_name: ssd-mobV1-coco-mlperf-300x300
      shortlisted: true
    

    od2000_artifacts.tar.gz

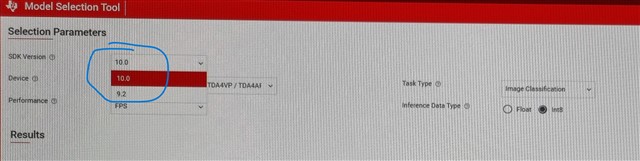
    As for Edge AI Studio, I only have access to the SDK 9.2 and 10.0 data sets in the Model Selection GUI, unfortunately. Do I need to do something special to get access to the 10.1 or 10.2 data sets?

    Kind regards,

    Christophe

  • Hi Christophe, 

    Thanks for the artifacts, I was missing one option in compilation.

    There are few possible reasons why the application note FPS values are higher than ours 
    1. basic_example.py and tidlrunner uses OSRT based flow for inference. I tried with TIDLRT based method of inference and I was able to get higher FPS which is somewhat comparable to application note. I checked the difference between how OSRT and TIDLRT computes execution time, it looks like TIDL takes just openvx process call time while osrt might be including copytime as well (this will need some further analysis)
    You can check TIDLRT method here software-dl.ti.com/.../md_tidl_model_import.html

    inFileFormat       = 1
    numFrames      = 100
    netBinFile       = /opt/edgeai-tidl-tools/runtimes/examples/model-artifacts/cl-0000/artifacts/87_tidl_net.bin
    ioConfigFile       = /opt/edgeai-tidl-tools/runtimes/examples/model-artifacts/cl-0000/artifacts/87_tidl_io_1.bin
    inData     = /opt/edgeai-tidl-tools/runtimes/examples/data/inputs/data.bin
    outData     = /opt/edgeai-tidl-tools/runtimes/examples/model-artifacts/cl-0000/artifacts/output.bin


    You can use something like above configuration for inference. There is a .out file in device at /opt/tidl_test/TI_DEVICE_armv8_test_dl_algo_host_rt.out and command to run inference is 
    ./TI_DEVICE_armv8_test_dl_algo_host_rt.out s:<infer_configuration_textfile_path>


    2. There might be small device specific differences because C7x compilers are different.


    As for Edge AI Studio, I only have access to the SDK 9.2 and 10.0 data sets in the Model Selection GUI, unfortunately. Do I need to do something special to get access to the 10.1 or 10.2 data sets?

    I am using https://dev.ti.com/edgeaistudio/ . This is public available i think.

    Regards,
    Vaibhav

  • Hi Christophe,

    Ok, thank you. I will investigate later this week with the basic_example.py and TIDLRT.

    As for the Edge AI Studio, I can only select from the 9.2 and 10.0 data sets. Maybe as a TI employee that you have more data sets available. Anyhow, I am going to focus on the real-life performance instead.


    Best regards,

    Christophe

  • Hi,

    Sure, you might be correct regarding 10.1 dataset.

  • Hi Vaibhav,

    The TIDLRT approach turns out to be less trivial than I had hoped for. I have limited myself to try reproducing your result for only a single model, i.e., CL-0000.


    I have used following configuration for importing the TFLite model, i.e. the same downloaded .tflite file used previously for the TIDL Runner approach. The configuration file is based on the example present in the Processor SDK RTOS for the J721S2 release 08.05.00.16. It is not present in any J784S4 release that I could find.

    modelType = 3
    numParamBits = 12
    quantizationStyle = 2
    inputNetFile = ../../test/testvecs/models/public/tflite/mobilenet_v1_1.0_224.tflite
    outputNetFile = "../../test/testvecs/config/tidl_models/tflite/tidl_net_tflite_mobilenet_v1_1.0_224.bin"
    outputParamsFile = "../../test/testvecs/config/tidl_models/tflite/tidl_io_tflite_mobilenet_v1_1.0_224_"
    inDataNorm = 1
    inMean = 128 128 128
    inScale = 0.0078125 0.0078125 0.0078125
    resizeWidth = 256
    resizeHeight = 256
    inWidth = 224
    inHeight = 224
    inNumChannels = 3
    inData = ../../test/testvecs/config/imageNet_sample_val_bg.txt

    Result of the import:


    ti-processor-sdk-rtos-j784s4-evm-11_02_00_06/c7x-mma-tidl/ti_dl/utils/tidlModelImport$ ./out/tidl_model_import.out ../../test/testvecs/config/import/public/tflite/tidl_import_mobileNetv1.txt
    ========================= [Model Compilation Started] =========================

    Model compilation will perform the following stages:
    1. Parsing
    2. Graph Optimization
    3. Quantization & Calibration
    4. Memory Planning

    ============================== [Version Summary] ==============================

    -------------------------------------------------------------------------------
    | TIDL Tools Version | 11_02_04_00 |
    -------------------------------------------------------------------------------
    | C7x Firmware Version | 11_02_04_00 |
    -------------------------------------------------------------------------------

    TFLite model (Flatbuf) file : ../../test/testvecs/models/public/tflite/mobilenet_v1_1.0_224.tflite
    TIDL network file : ../../test/testvecs/config/tidl_models/tflite/tidl_net_tflite_mobilenet_v1_1.0_224.bin
    TIDL IO info file : ../../test/testvecs/config/tidl_models/tflite/tidl_io_tflite_mobilenet_v1_1.0_224_
    Number of operators: 34
    ============================ [Optimization started] ============================

    ----------------------------- Optimization Summary -----------------------------
    ---------------------------------------------------------------------------------
    | Layer | Nodes before optimization | Nodes after optimization |
    ---------------------------------------------------------------------------------
    | TIDL_InnerProductLayer | 0 | 1 |
    | TIDL_CastLayer | 1 | 0 |
    | TIDL_BatchNormLayer | 2 | 0 |
    | TIDL_ConvolutionLayer | 28 | 27 |
    | TIDL_SoftMaxLayer | 1 | 1 |
    | TIDL_PoolingLayer | 1 | 1 |
    ---------------------------------------------------------------------------------

    Total nodes in subgraph: 32

    =========================== [Optimization completed] ===========================


    -------- Running Calibration in Float Mode to Collect Tensor Statistics --------
    [===================> ] 25 %
    A : 896, 0.0000, 0.0000, 112[======================================> ] 50 %
    A : 558, 0.0000, 0.0000, 112[=========================================================> ] 75 %
    A : 443, 0.0000, 0.0000, 112[=============================================================================] 100 %
    A : 499, 0.0000, 0.0000, 112

    ------------------ Fixed-point Calibration Iteration [1 / 1]: ------------------
    [===================> ] 25 %
    A : 896, 0.0000, 0.0000, 645[======================================> ] 50 %
    A : 558, 0.0000, 0.0000, 645[=========================================================> ] 75 %
    A : 443, 0.0000, 0.0000, 620[=============================================================================] 100 %
    A : 499, 0.0000, 0.0000, 645

    ==================== [Quantization & Calibration Completed] ====================

    ========================== [Memory Planning Started] ==========================


    ------------------------- Network Compiler Traces ------------------------------
    Successful Memory Allocation
    Successful Workload Creation

    ========================= [Memory Planning Completed] =========================

    Rerunning network compiler...
    ========================== [Memory Planning Started] ==========================


    ------------------------- Network Compiler Traces ------------------------------
    Successful Memory Allocation
    Successful Workload Creation

    ========================= [Memory Planning Completed] =========================

    ======================== Subgraph Compiled Successfully ========================

    Inferred on the host pc with following configuration, again based on the example from the J721S2 PSDK. This seemed to run fine.


    inFileFormat = 2
    postProcType = 1
    numFrames = 1
    netBinFile = "testvecs/config/tidl_models/tflite/tidl_net_tflite_mobilenet_v1_1.0_224.bin"
    ioConfigFile = "testvecs/config/tidl_models/tflite/tidl_io_tflite_mobilenet_v1_1.0_224_1.bin"
    inData = testvecs/config/classification_list_1.txt
    outData = testvecs/output/airshow_mobilenetv2_tf.bin
    writeTraceLevel = 3
    debugTraceLevel = 1

    Next step was inference on the EVM after copying the testvecs folder from the host pc to the EVM. Same configuration file was used.

    <root@j784s4-evm:/opt/tidl_test# ./TI_DEVICE_armv8_test_dl_algo_host_rt.out s:testvecs/config/infer/public/tflite/tidl_infer_mobileNetv1.txt 
    
    	Processing config file #0 : testvecs/config/infer/public/tflite/tidl_infer_mobileNetv1.txt 
    	Input : dataId=0, name=input_original, elementType 2, scale=1.000000, zero point=0, layout=0
    	Ouput : dataId=30, name=MobilenetV1/Predictions/Reshape_1, elementType 6, scale=1.000000, zero point=0, layout=0 
    	 worstCaseDelay for Pre-emption is 0.7363403 
    	APP: Init ... !!!
    	   300.932289 s: MEM: Init ... !!!
    	   300.932341 s: MEM: Initialized DMA HEAP (fd=4) !!!
    	   300.932480 s: MEM: Init ... Done !!!
    	   300.932498 s: IPC: Init ... !!!
    	   300.962607 s: IPC: Init ... Done !!!
    	REMOTE_SERVICE: Init ... !!!
    	REMOTE_SERVICE: Init ... Done !!!
    	   300.970428 s: GTC Frequency = 200 MHz
    	APP: Init ... Done !!!
    	   300.970515 s: VX_ZONE_INFO: Globally Enabled VX_ZONE_ERROR
    	   300.970526 s: VX_ZONE_INFO: Globally Enabled VX_ZONE_WARNING
    	   300.970534 s: VX_ZONE_INFO: Globally Enabled VX_ZONE_INFO
    	   300.971255 s: VX_ZONE_INFO: [tivxPlatformCreateTargetId:169] Added target MPU-0 
    	   300.971450 s: VX_ZONE_INFO: [tivxPlatformCreateTargetId:169] Added target MPU-1 
    	   300.971554 s: VX_ZONE_INFO: [tivxPlatformCreateTargetId:169] Added target MPU-2 
    	   300.971645 s: VX_ZONE_INFO: [tivxPlatformCreateTargetId:169] Added target MPU-3 
    	   300.971656 s: VX_ZONE_INFO: [tivxInitLocal:202] Initialization Done !!!
    	   300.971668 s: VX_ZONE_INFO: Globally Disabled VX_ZONE_INFO
    	
    	# NETWORK_INIT_TIME =   152.97 (in ms, c7x @1GHz)
    	 Freeing memory for user provided Net
    	
    	 Instance created for testvecs/config/infer/public/tflite/tidl_infer_mobileNetv1.txt
    	 Freeing memory for user provided Net
    	 ----------------------- TIDL Process with TARGET DATA FLOW ------------------------
    	[C7x_1 ]    301.094639 s:    0         1.00000         0.00000       255.00000 2
    	[C7x_1 ]    301.094656 s: 
    	[C7x_1 ]    301.112942 s:    1     10922.66699         0.00000         6.00000 2
    	[C7x_1 ]    301.112958 s: 
    	[C7x_1 ]    301.155412 s:    2     10922.66699         0.00000         6.00000 2
    	[C7x_1 ]    301.155427 s: 
    	[C7x_1 ]    301.198573 s:    3     10922.66699         0.00000         6.00000 2
    	[C7x_1 ]    301.198588 s: 
    	[C7x_1 ]    301.286660 s:    4     10922.66699         0.00000         6.00000 2
    	[C7x_1 ]    301.286675 s: 
    	[C7x_1 ]    301.309583 s:    5     10922.66699         0.00000         6.00000 2
    	[C7x_1 ]    301.309598 s: 
    	[C7x_1 ]    301.355153 s:    6     10922.66699         0.00000         6.00000 2
    	[C7x_1 ]    301.355168 s: 
    	[C7x_1 ]    301.400396 s:    7     10922.66699         0.00000         6.00000 2
    	[C7x_1 ]    301.400411 s: 
    	[C7x_1 ]    301.443482 s:    8     10922.66699         0.00000         6.00000 2
    	[C7x_1 ]    301.443497 s: 
    	[C7x_1 ]    301.455381 s:    9     10922.66699         0.00000         6.00000 2
    	[C7x_1 ]    301.455396 s: 
    	[C7x_1 ]    301.478206 s:   10     10922.66699         0.00000         6.00000 2
    	[C7x_1 ]    301.478221 s: 
    	[C7x_1 ]    301.500203 s:   11     10922.66699         0.00000         6.00000 2
    	[C7x_1 ]    301.500218 s: 
    	[C7x_1 ]    301.521569 s:   12     10922.66699         0.00000         6.00000 2
    	[C7x_1 ]    301.521584 s: 
    	[C7x_1 ]    301.527659 s:   13     10922.66699         0.00000         6.00000 2
    	[C7x_1 ]    301.527674 s: 
    	[C7x_1 ]    301.539255 s:   14     10922.66699         0.00000         6.00000 2
    	[C7x_1 ]    301.539270 s: 
    	[C7x_1 ]    301.550596 s:   15     10922.66699         0.00000         6.00000 2
    	[C7x_1 ]    301.550611 s: 
    	[C7x_1 ]    301.561888 s:   16     10922.66699         0.00000         6.00000 2
    	[C7x_1 ]    301.561903 s: 
    	[C7x_1 ]    301.573150 s:   17     10922.66699         0.00000         6.00000 2
    	[C7x_1 ]    301.573166 s: 
    	[C7x_1 ]    301.584275 s:   18     10922.66699         0.00000         6.00000 2
    	[C7x_1 ]    301.584290 s: 
    	[C7x_1 ]    301.595462 s:   19     10922.66699         0.00000         6.00000 2
    	[C7x_1 ]    301.595477 s: 
    	[C7x_1 ]    301.606597 s:   20     10922.66699         0.00000         6.00000 2
    	[C7x_1 ]    301.606612 s: 
    	[C7x_1 ]    301.617890 s:   21     10922.66699         0.00000         6.00000 2
    	[C7x_1 ]    301.617905 s: 
    	[C7x_1 ]    301.628829 s:   22     10922.66699         0.00000         6.00000 2
    	[C7x_1 ]    301.628845 s: 
    	[C7x_1 ]    301.640129 s:   23     10922.66699         0.00000         6.00000 2
    	[C7x_1 ]    301.640145 s: 
    	[C7x_1 ]    301.650818 s:   24     10922.66699         0.00000         6.00000 2
    	[C7x_1 ]    301.650832 s: 
    	[C7x_1 ]    301.654157 s:   25     10922.66699         0.00000         6.00000 2
    	[C7x_1 ]    301.654173 s: 
    	[C7x_1 ]    301.659785 s:   26     10922.66699         0.00000         6.00000 2
    	[C7x_1 ]    301.659800 s: 
    	[C7x_1 ]    301.666170 s:   27     10922.66699         0.00000         6.00000 2
    	[C7x_1 ]    301.666185 s: 
    	Error opening performance debug file
    	             Layer,      Layer Cycles,  kernelOnlyCycles,    coreLoopCycles,  LayerSetupCycles,   dmaPipeupCycles,   LayerHandleCopy,     RestoreCycles,Multic7xContextCopyCycles,  DDRBWReadInBytes, DDRBW,
    	                 1,          60736679,             26029,             29024,             12569,             13087,              4433,                 0,                 0,                 0,             ,
    	                 2,          43154332,             25530,             31109,              8539,              5135,              4174,                 0,                 0,                 0,             ,
    	                 3,          88063144,             31717,             35881,              9845,              5572,              3516,                 0,                 0,                 0,             ,
    	                 4,          22943998,             51796,             59252,              7679,              4911,              3672,                 0,                 0,                 0,             ,
    	                 5,          45564050,             29941,             32357,              9701,              5454,              3596,                 0,                 0,                 0,             ,
    	                 6,          45210415,             26689,             40063,              8104,              2589,              4131,                 0,                 0,                 0,             ,
    	                 7,          43116693,             58135,             63141,             10622,              6345,              3847,                 0,                 0,                 0,             ,
    	                 8,          11892471,             28300,             32066,              8002,              5417,              3839,                 0,                 0,                 0,             ,
    	                 9,          22838831,             29852,             32001,              9708,              8116,              3613,                 0,                 0,                 0,             ,
    	                10,          21943094,             12971,             14222,              7930,             10477,              3818,                 0,                 0,                 0,             ,
    	                11,          21399683,             59243,             63622,              8862,             10549,              3225,                 0,                 0,                 0,             ,
    	                12,           6070990,             28245,             29671,              7766,              9811,              4080,                 0,                 0,                 0,             ,
    	                13,          11616736,             34708,             37026,              9381,             16007,              3630,                 0,                 0,                 0,             ,
    	                14,          11237822,             15413,             16625,              7886,             10549,              3783,                 0,                 0,                 0,             ,
    	                15,          11390690,             74794,             93946,             11181,             31912,              3827,                 0,                 0,                 0,             ,
    	                16,          11156875,             15161,             16382,              8001,             10972,              4114,                 0,                 0,                 0,             ,
    	                17,          11224765,             74694,             92534,             11777,             32250,              4192,                 0,                 0,                 0,             ,
    	[C7x_1 ]    301.671713 s:   28      5461.33350         0.00000         5.86945 2
    	                18,          11083451,             15293,             16569,              7371,             10650,              3343,                 0,                 0,                 0,             ,
    	[C7x_1 ]    301.671728 s: 
    	                19,          11230475,             74729,             92491,             10292,             32064,              3440,                 0,                 0,                 0,             ,
    	                20,          11219626,             15311,             16951,              7856,             10825,              3790,                 0,                 0,                 0,             ,
    	[C7x_1 ]    301.672243 s:   29      3056.12500        -5.96990         6.86204 3
    	                21,          11007694,             74691,             92113,              8908,              5341,              3255,                 0,                 0,                 0,             ,
    	[C7x_1 ]    301.672258 s: 
    	                22,          11196495,             15525,             16822,              7648,             10461,              3832,                 0,                 0,                 0,             ,
    	                23,          10769261,             74619,             92578,             10867,             32128,              3907,                 0,                 0,                 0,             ,
    	[C7x_1 ]    301.672698 s:   30         1.00000         0.00000         0.08088 6
    	                24,           3263105,             32334,             33299,              7740,             10209,              3851,                 0,                 0,                 0,             ,
    	[C7x_1 ]    301.672712 s: 
    	                25,           5700985,             46176,             54687,             10383,             58439,              3783,                 0,                 0,                 0,             ,
    	                26,           6178327,             21949,             22916,              9006,             14720,              3777,                 0,                 0,                 0,             ,
    	                27,           5769133,             97504,            128624,              9389,            112083,              3359,                 0,                 0,                 0,             ,
    	                28,            401195,              8260,              9565,              5632,              4922,              3291,                 0,                 0,                 0,             ,
    	                29,            537596,             46924,             46924,                 0,                 0,                 0,                 0,                 0,                 0,             ,
    	                30,            289104,              3712,              6776,              8909,              1343,              3852,                 0,                 0,                 0,             ,
    	 Sum of Layer Cycles 578207715 
    	
    	# NETWORK_EXECUTION_TIME =   580.82 (in ms, c7x @1GHz) with DDR_BANDWIDTH (Read + Write) =   668.21,    17.37,   685.58 (in Mega Bytes/frame) ...
    	 A :   896, 0.0000, 0.0000,   645 .... .....APP: Deinit ... !!!
    	REMOTE_SERVICE: Deinit ... !!!
    	REMOTE_SERVICE: Deinit ... Done !!!
    	   302.025201 s: IPC: Deinit ... !!!
    	   302.026538 s: IPC: DeInit ... Done !!!
    	   302.026574 s: MEM: Deinit ... !!!
    	   302.026587 s: DDR_SHARED_MEM: Alloc's: 8 alloc's of 77916404 bytes 
    	   302.026595 s: DDR_SHARED_MEM: Free's : 8 free's  of 77916404 bytes 
    	   302.026602 s: DDR_SHARED_MEM: Open's : 0 allocs  of 0 bytes 
    	   302.026614 s: MEM: Deinit ... Done !!!
    APP: Deinit ... Done !!!

    Though, I am not getting a number of megacycles in the log as shown in TI Deep Learning Product User Guide: TIDL-RT Inference with Sample Application. If the Network Execution Time is any indication of the FPS performance, then it doesn't look to well. 581 ms, which would be less than 2 FPS. Clearly, something is off.

    Therefore, would you mind sharing your config files used for importing and inferring the CL-0000 model? Something that is not clear to me either in your inference config example, are the netBinFile and ioConfigFile names and file paths. These are identical to the ones of the TIDL Runner approach (names starting with the 87_ prefix). I am confused by these. These files should be the ones generated by the import tool, right? Are they just identical by coincidence in your case?

    For what it is worth, both the inference on the host pc and EVM result in an identical output binary file. Then again, I have no idea what this file should represent. I have tried opening it as a raw image under different settings, but keep getting rubbish.

    ti-processor-sdk-rtos-j784s4-evm-11_02_00_06/c7x-mma-tidl$ diff -s airshow_mobilenetv2_tf.bin ti_dl/test/testvecs/output/airshow_mobilenetv2_tf.bin

    Files airshow_mobilenetv2_tf.bin and ti_dl/test/testvecs/output/airshow_mobilenetv2_tf.bin are identical

    Kind regards,

    Christophe

  • Hi Christophe,

    The configuration file is based on the example present in the Processor SDK RTOS for the J721S2 release 08.05.00.16. It is not present in any J784S4 release that I could find.

    The reason for this is TIDL is promoting edge-tidl-tools based compilation and inference for new releases because it is more user-friendly. This TIDLRT approach is used for measuring performance in test automation etc. In in a full fledged vision hardware application (eg objection detection openvx pipeline) will use TIDL in similar fashion as TIDLRT so the performance measurements will be more practical.

    IMPORTING/COMPILATION: I haven't used this configuration based method for compilation. I just used edgeai-tidl-tools as there is no difference in compilation and I would suggest the same.

    INFERENCE: I was suggesting configuration based method only for inference.

    Though, I am not getting a number of megacycles in the log as shown in TI Deep Learning Product User Guide: TIDL-RT Inference with Sample Application. If the Network Execution Time is any indication of the FPS performance, then it doesn't look to well. 581 ms, which would be less than 2 FPS. Clearly, something is off.

    You are using writeTraceLevel which will write binary output of every layer to file and debugTraceLevel will print layer processing logs. These both are taking time in your case. 

    Therefore, would you mind sharing your config files used for importing and inferring the CL-0000 model?

    Exactly the one shared as example in my previous message.

    Something that is not clear to me either in your inference config example, are the netBinFile and ioConfigFile names and file paths. These are identical to the ones of the TIDL Runner approach (names starting with the 87_ prefix). I am confused by these. These files should be the ones generated by the import tool, right? Are they just identical by coincidence in your case?

    No, as I have mentioned above I have used edgeai-tidl-tools (onnxrt) for compilation and not tidl_model_import.out(tidlrt) . Edgeai-tiidl-tools is similar to tidl runner approach so that why name are same i believe.

    For what it is worth, both the inference on the host pc and EVM result in an identical output binary file. Then again, I have no idea what this file should represent. I have tried opening it as a raw image under different settings, but keep getting rubbish.

    The final output binary file is the output dump of the final output nodes of model in same order as onnx (data type can be seen from compiled artifacts) or the order provided in configuration. For eg. cl-0000 gives 1x1001 as output , so assuming fp32 output , this output binary file can be read as 1x1001 fp32 values written in binary. 
    The post processing which used to be taken care of in edgeai-tidl-tools is not taken care of here. Post processing has to be done separately, usually in separate node in real application.

    Regards, 
    Vaibhav

  • Hi Vaibhav,

    That were quite some misunderstandings from my side. Thank you very much for clarifying them.

    Switched to your suggested inference configuration, as below. Note that I don't have or cannot find any data.bin file. Maybe it is necessary to have one with 100 concated, raw images to handle the number of 100 frames. That part is not clear to me.

    inFileFormat = 0
    numFrames = 100
    netBinFile = "/opt/edgeai-tidlrunner/work_dirs/compile/TDA4VH/8bits/cl-0000_tflitert_imagenet1k_mlperf_mobilenet_v1_1.0_224_tflite/artifacts/87_tidl_net.bin"
    ioConfigFile = "/opt/edgeai-tidlrunner/work_dirs/compile/TDA4VH/8bits/cl-0000_tflitert_imagenet1k_mlperf_mobilenet_v1_1.0_224_tflite/artifacts/87_tidl_io_1.bin"
    inData = /opt/tidl_test/testvecs/input/airshow.bmp
    outData = /opt/tidl_test/testvecs/output/airshow_mobilenetv2_tf.bin


    Result on EVM:


    root@j784s4-evm:/opt/tidl_test# ./TI_DEVICE_armv8_test_dl_algo_host_rt.out s:testvecs/config/infer/public/tflite/tidl_infer_mobileNetv1.txt 
    
    Processing config file #0 : testvecs/config/infer/public/tflite/tidl_infer_mobileNetv1.txt 
    APP: Init ... !!!
      2734.193321 s: MEM: Init ... !!!
      2734.193377 s: MEM: Initialized DMA HEAP (fd=4) !!!
      2734.193526 s: MEM: Init ... Done !!!
      2734.193544 s: IPC: Init ... !!!
      2734.219748 s: IPC: Init ... Done !!!
    REMOTE_SERVICE: Init ... !!!
    REMOTE_SERVICE: Init ... Done !!!
      2734.227477 s: GTC Frequency = 200 MHz
    APP: Init ... Done !!!
      2734.227595 s: VX_ZONE_INFO: Globally Enabled VX_ZONE_ERROR
      2734.227604 s: VX_ZONE_INFO: Globally Enabled VX_ZONE_WARNING
      2734.227611 s: VX_ZONE_INFO: Globally Enabled VX_ZONE_INFO
      2734.228617 s: VX_ZONE_INFO: [tivxPlatformCreateTargetId:169] Added target MPU-0 
      2734.228777 s: VX_ZONE_INFO: [tivxPlatformCreateTargetId:169] Added target MPU-1 
      2734.228909 s: VX_ZONE_INFO: [tivxPlatformCreateTargetId:169] Added target MPU-2 
      2734.229017 s: VX_ZONE_INFO: [tivxPlatformCreateTargetId:169] Added target MPU-3 
      2734.229035 s: VX_ZONE_INFO: [tivxInitLocal:202] Initialization Done !!!
      2734.229047 s: VX_ZONE_INFO: Globally Disabled VX_ZONE_INFO
    
    # NETWORK_INIT_TIME =    85.19 (in ms, c7x @1GHz)
     ----------------------- TIDL Process with TARGET DATA FLOW ------------------------
    
    # NETWORK_EXECUTION_TIME =     2.13 (in ms, c7x @1GHz) with DDR_BANDWIDTH (Read + Write) =     0.45,     5.54,     5.99 (in Mega Bytes/frame) ... .... ..... ----------------------- TIDL Process with TARGET DATA FLOW ------------------------
    
    # NETWORK_EXECUTION_TIME =     1.78 (in ms, c7x @1GHz) with DDR_BANDWIDTH (Read + Write) =     0.26,     3.38,     3.64 (in Mega Bytes/frame) ... .... ..... ----------------------- TIDL Process with TARGET DATA FLOW ------------------------
    
    # NETWORK_EXECUTION_TIME =     1.74 (in ms, c7x @1GHz) with DDR_BANDWIDTH (Read + Write) =     0.22,     3.29,     3.51 (in Mega Bytes/frame) ... .... ..... ----------------------- TIDL Process with TARGET DATA FLOW ------------------------
    
    # NETWORK_EXECUTION_TIME =     1.73 (in ms, c7x @1GHz) with DDR_BANDWIDTH (Read + Write) =     0.21,     3.27,     3.48 (in Mega Bytes/frame) ... .... ..... ----------------------- TIDL Process with TARGET DATA FLOW ------------------------
    
    ...
    
    # NETWORK_EXECUTION_TIME =     1.72 (in ms, c7x @1GHz) with DDR_BANDWIDTH (Read + Write) =     0.18,     3.24,     3.42 (in Mega Bytes/frame) ... .... ..... ----------------------- TIDL Process with TARGET DATA FLOW ------------------------
    
    # NETWORK_EXECUTION_TIME =     1.73 (in ms, c7x @1GHz) with DDR_BANDWIDTH (Read + Write) =     0.18,     3.24,     3.42 (in Mega Bytes/frame) ... .... .....APP: Deinit ... !!!
    REMOTE_SERVICE: Deinit ... !!!
    REMOTE_SERVICE: Deinit ... Done !!!
      2734.949417 s: IPC: Deinit ... !!!
      2734.950442 s: IPC: DeInit ... Done !!!
      2734.950474 s: MEM: Deinit ... !!!
      2734.950487 s: DDR_SHARED_MEM: Alloc's: 7 alloc's of 6585972 bytes 
      2734.950499 s: DDR_SHARED_MEM: Free's : 7 free's  of 6585972 bytes 
      2734.950516 s: DDR_SHARED_MEM: Open's : 0 allocs  of 0 bytes 
      2734.950532 s: MEM: Deinit ... Done !!!
    APP: Deinit ... Done !!!


    So, for the first frame 2.13 ms, and for all following frames 1.72 ms. The latter result (581 fps) is in line with the OSRT. But it would need to be closer to 1.4 ms to achieve the 714 fps from your run. Could the data.bin file be the difference?

    Kind regards,

    Christophe

  • Maybe it is necessary to have one with 100 concated, raw images to handle the number of 100 frames. That part is not clear to me.

    Yes, you are right , 100 concatenated inputs written to binary file.

    So, for the first frame 2.13 ms, and for all following frames 1.72 ms. The latter result (581 fps) is in line with the OSRT. But it would need to be closer to 1.4 ms to achieve the 714 fps from your run. Could the data.bin file be the difference?

    No, this not because of data.bin file because NETWORK_EXECUTION_TIME calculation is completely separate from input reading, it is just vxProcessGraph time for frame. The difference is because of compilation configuration, I used quantization_scale_type = 0 (default) and tidl runner uses quantization_scale_type = 4 which adds an additional Batchnorm layer (you can check in html network file). 

    Also, I might have slightly approximated my calculations to 1.4ms because I saw some 1.45,1,47 etc . After looking carefully, I would say it is around 1.45-1.5ms so there is still some gap between application note and real performance we are getting but its getting closer :)

    Regards, 
    Vaibhav