This thread has been locked.

If you have a related question, please click the "Ask a related question" button in the top right corner. The newly created question will be automatically linked to this question.

K2HK: UDP packet loss issue

Expert 1800 points

Hi,

I have posted an issue of packet loss in Linux forum.  But the issue is not in linux kernel, the real issue is packet missing at ARM CPU. So, I am moving the question to Keystone forum. Please find the copy of post from linux.

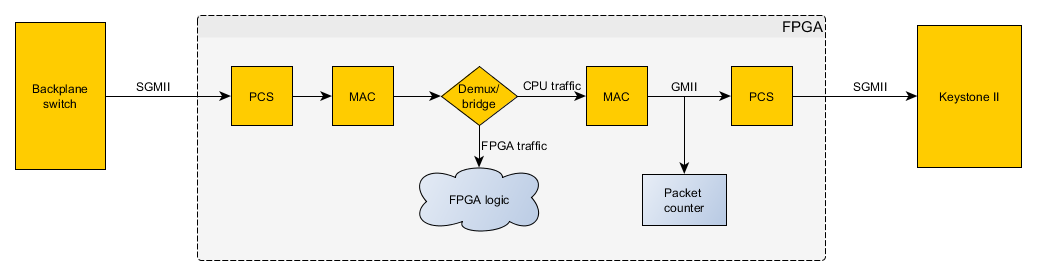
We are having custom board based on 66AK2H06.  We are losing  UDP packets between two custom boards.  Port 0 is interfaced to FPGA which in turn is connected to backplane. The two custom boards talk to each other over backplane.  One of the application from board 1 sends bursty traffic less than 50Mbps.  We see that the packets are lost.  There are no RcvBuf errors and InErrors reported in linux kernel.  

No errors seen in CPSW statistics as seen by following command.

ethtool -S eth0

There are no drops seen in any of the socket Qs when observed using

cat /proc/net/udp.

We have a FPGA probe which monitors the sequence number of the packets for all the ports.  When the packet loss happens, we do not see any packet lost until the FPGA nor in Linux.  The packets are dropped somewhere between FPGA and CPU.  Is that possible to get additional debug information on the switch statistics.

Is there any additional configuration required for CPSW ?

We are trying to send UDP traffic using iperf and the FPGA in Board 2 (Receiver Board) is probing the incoming UDP traffic on port 5001. The FPGA probe counter sees all the packets at the receiving end. But the packets are lost at CPU and not seen in Linux.
Please see below the log from iperf, netstat and FPGA probe.

~ $ iperf3 -c 192.168.0.104 -u -b 200M -l 1500 -p 5001
Connecting to host 192.168.0.104, port 5001
[ 4] local 192.168.0.102 port 58203 connected to 192.168.0.104 port 5001
[ ID] Interval Transfer Bandwidth Total Datagrams
[ 4] 0.00-1.00 sec 21.5 MBytes 181 Mbits/sec 15063
[ 4] 1.00-2.00 sec 24.9 MBytes 209 Mbits/sec 17426
[ 4] 2.00-3.00 sec 22.7 MBytes 191 Mbits/sec 15899
[ 4] 3.00-4.00 sec 25.4 MBytes 213 Mbits/sec 17760
[ 4] 4.00-5.00 sec 22.9 MBytes 192 Mbits/sec 16039
[ 4] 5.00-6.00 sec 25.3 MBytes 212 Mbits/sec 17656
[ 4] 6.00-7.00 sec 22.5 MBytes 189 Mbits/sec 15748
[ 4] 7.00-8.00 sec 23.9 MBytes 201 Mbits/sec 16739
[ 4] 8.00-9.00 sec 23.4 MBytes 197 Mbits/sec 16380
[ 4] 9.00-10.00 sec 23.5 MBytes 197 Mbits/sec 16435
- - - - - - - - - - - - - - - - - - - - - - - - -
[ ID] Interval Transfer Bandwidth Jitter Lost/Total Datagrams
[ 4] 0.00-10.00 sec 236 MBytes 198 Mbits/sec 0.022 ms 4096/165145 (2.5%)
[ 4] Sent 165145 datagrams

iperf Done.


################## Board 1 Receiver: ###############################

~ $ netstat.arm -s
Ip:
1421153 total packets received
0 forwarded
0 incoming packets discarded
1097051 incoming packets delivered
590165 requests sent out
173 fragments dropped after timeout
647641 reassemblies required
323539 packets reassembled ok
563 packet reassembles failed
Icmp:
67 ICMP messages received
0 input ICMP message failed.
InCsumErrors: 0
ICMP input histogram:
destination unreachable: 67
416 ICMP messages sent
0 ICMP messages failed
ICMP output histogram:
destination unreachable: 397
time exceeded: 19
IcmpMsg:
InType3: 67
OutType3: 397
OutType11: 19
Tcp:
5 active connections openings
6 passive connection openings
1 failed connection attempts
3 connection resets received
6 connections established
17357 segments received
20548 segments send out
0 segments retransmited
0 bad segments received.
1 resets sent
InCsumErrors: 0
Udp:
1053123 packets received
103635 packets to unknown port received.
0 packet receive errors
569302 packets sent
RcvbufErrors: 0
SndbufErrors: 0
InCsumErrors: 0
UdpLite:
InDatagrams: 0
NoPorts: 0
InErrors: 0
OutDatagrams: 0
RcvbufErrors: 0
SndbufErrors: 0
InCsumErrors: 0
error parsing /proc/net/snmp: Success


################# FPGA status ####################

Status 32769: "Packet loss monitor"
* Timestamp : 2015-09-10 14:01:46.614067
Packet cnt. : 165146

  • Hi Rams,Have you checked the behavior on K2H EVM?
  • Hello,

    No, I have not done this test with two K2H EVMs

    Thanks

    Rams

  • Hi Rams,

    I have tested the same UDP traffic between two K2H boards with "iperf3" and "iperf"
    FYI: By default you would get "iperf" in filesystem, I have cross compiled the iperf3 to reproduce your issue.

    I don't see your observation on K2H EVM boards and getting 0% error.


    root@k2hk-evm:/# ./iperf3 -c 10.100.1.20
    Connecting to host 10.100.1.20, port 5201
    [ 4] local 10.100.1.10 port 33602 connected to 10.100.1.20 port 5201
    [ ID] Interval Transfer Bandwidth Retr Cwnd
    [ 4] 0.00-1.01 sec 112 MBytes 939 Mbits/sec 0 277 KBytes
    [ 4] 1.01-2.01 sec 112 MBytes 941 Mbits/sec 0 280 KBytes
    [ 4] 2.01-3.01 sec 112 MBytes 941 Mbits/sec 0 281 KBytes
    [ 4] 3.01-4.00 sec 111 MBytes 941 Mbits/sec 0 281 KBytes
    [ 4] 4.00-5.01 sec 112 MBytes 941 Mbits/sec 0 283 KBytes
    [ 4] 5.01-6.00 sec 112 MBytes 941 Mbits/sec 0 387 KBytes
    [ 4] 6.00-7.01 sec 112 MBytes 941 Mbits/sec 0 387 KBytes
    [ 4] 7.01-8.01 sec 112 MBytes 941 Mbits/sec 0 387 KBytes
    [ 4] 8.01-9.00 sec 111 MBytes 941 Mbits/sec 0 387 KBytes
    [ 4] 9.00-10.00 sec 112 MBytes 941 Mbits/sec 0 387 KBytes
    - - - - - - - - - - - - - - - - - - - - - - - - -
    [ ID] Interval Transfer Bandwidth Retr
    [ 4] 0.00-10.00 sec 1.10 GBytes 941 Mbits/sec 0 sender
    [ 4] 0.00-10.00 sec 1.10 GBytes 941 Mbits/sec receiver

    iperf Done.
    root@k2hk-evm:/# ./iperf3 -c 10.100.1.20 -u -b 50M
    Connecting to host 10.100.1.20, port 5201
    [ 4] local 10.100.1.10 port 32773 connected to 10.100.1.20 port 5201
    [ ID] Interval Transfer Bandwidth Total Datagrams
    [ 4] 0.00-1.00 sec 5.40 MBytes 45.3 Mbits/sec 691
    [ 4] 1.00-2.00 sec 5.96 MBytes 50.0 Mbits/sec 763
    [ 4] 2.00-3.00 sec 5.96 MBytes 50.0 Mbits/sec 763
    [ 4] 3.00-4.00 sec 5.96 MBytes 50.0 Mbits/sec 763
    [ 4] 4.00-5.00 sec 5.96 MBytes 50.0 Mbits/sec 763
    [ 4] 5.00-6.00 sec 5.96 MBytes 50.0 Mbits/sec 763
    [ 4] 6.00-7.00 sec 5.96 MBytes 50.0 Mbits/sec 763
    [ 4] 7.00-8.00 sec 5.96 MBytes 50.0 Mbits/sec 763
    [ 4] 8.00-9.00 sec 5.96 MBytes 50.0 Mbits/sec 763
    [ 4] 9.00-10.00 sec 5.96 MBytes 50.0 Mbits/sec 763
    - - - - - - - - - - - - - - - - - - - - - - - - -
    [ ID] Interval Transfer Bandwidth Jitter Lost/Total Datagrams
    [ 4] 0.00-10.00 sec 59.0 MBytes 49.5 Mbits/sec 0.003 ms 0/7558 (0%)
    [ 4] Sent 7558 datagrams

    iperf Done.
    root@k2hk-evm:/#
    root@k2hk-evm:/#
    root@k2hk-evm:/# ./iperf3 -c 10.100.1.20 -u -b 200M -l 1500
    Connecting to host 10.100.1.20, port 5201
    [ 4] local 10.100.1.10 port 51396 connected to 10.100.1.20 port 5201
    [ ID] Interval Transfer Bandwidth Total Datagrams
    [ 4] 0.00-1.00 sec 23.6 MBytes 198 Mbits/sec 16479
    [ 4] 1.00-2.00 sec 24.0 MBytes 202 Mbits/sec 16794
    [ 4] 2.00-3.00 sec 23.6 MBytes 198 Mbits/sec 16468
    [ 4] 3.00-4.00 sec 24.2 MBytes 203 Mbits/sec 16914
    [ 4] 4.00-5.00 sec 23.5 MBytes 197 Mbits/sec 16434
    [ 4] 5.00-6.00 sec 24.2 MBytes 203 Mbits/sec 16887
    [ 4] 6.00-7.00 sec 23.6 MBytes 198 Mbits/sec 16487
    [ 4] 7.00-8.00 sec 24.1 MBytes 202 Mbits/sec 16855
    [ 4] 8.00-9.00 sec 23.5 MBytes 197 Mbits/sec 16442
    [ 4] 9.00-10.00 sec 24.2 MBytes 203 Mbits/sec 16902
    - - - - - - - - - - - - - - - - - - - - - - - - -
    [ ID] Interval Transfer Bandwidth Jitter Lost/Total Datagrams
    [ 4] 0.00-10.00 sec 238 MBytes 200 Mbits/sec 0.001 ms 0/166662 (0%)
    [ 4] Sent 166662 datagrams

    iperf Done.
    root@k2hk-evm:/#


    IPERF SERVER LOG:


    root@k2hk-evm:/# ./iperf3 -s
    -----------------------------------------------------------
    Server listening on 5201
    -----------------------------------------------------------
    Accepted connection from 10.100.1.10, port 33601
    [ 5] local 10.100.1.20 port 5201 connected to 10.100.1.10 port 33602
    [ ID] Interval Transfer Bandwidth
    [ 5] 0.00-1.00 sec 112 MBytes 936 Mbits/sec
    [ 5] 1.00-2.00 sec 112 MBytes 941 Mbits/sec
    [ 5] 2.00-3.00 sec 112 MBytes 941 Mbits/sec
    [ 5] 3.00-4.00 sec 112 MBytes 941 Mbits/sec
    [ 5] 4.00-5.00 sec 112 MBytes 941 Mbits/sec
    [ 5] 5.00-6.00 sec 112 MBytes 941 Mbits/sec
    [ 5] 6.00-7.00 sec 112 MBytes 941 Mbits/sec
    [ 5] 7.00-8.00 sec 112 MBytes 941 Mbits/sec
    [ 5] 8.00-9.00 sec 112 MBytes 941 Mbits/sec
    [ 5] 9.00-10.00 sec 112 MBytes 941 Mbits/sec
    [ 5] 10.00-10.01 sec 726 KBytes 937 Mbits/sec
    - - - - - - - - - - - - - - - - - - - - - - - - -
    [ ID] Interval Transfer Bandwidth
    [ 5] 0.00-10.01 sec 0.00 Bytes 0.00 bits/sec sender
    [ 5] 0.00-10.01 sec 1.10 GBytes 941 Mbits/sec receiver
    -----------------------------------------------------------
    Server listening on 5201
    -----------------------------------------------------------


    Accepted connection from 10.100.1.10, port 33603
    [ 5] local 10.100.1.20 port 5201 connected to 10.100.1.10 port 32773
    [ ID] Interval Transfer Bandwidth Jitter Lost/Total Datagrams
    [ 5] 0.00-1.00 sec 5.40 MBytes 45.3 Mbits/sec 0.005 ms 0/691 (0%)
    [ 5] 1.00-2.00 sec 5.96 MBytes 50.0 Mbits/sec 0.004 ms 0/763 (0%)
    [ 5] 2.00-3.00 sec 5.96 MBytes 50.0 Mbits/sec 0.005 ms 0/763 (0%)
    [ 5] 3.00-4.00 sec 5.96 MBytes 50.0 Mbits/sec 0.005 ms 0/763 (0%)
    [ 5] 4.00-5.00 sec 5.96 MBytes 50.0 Mbits/sec 0.005 ms 0/763 (0%)
    [ 5] 5.00-6.00 sec 5.96 MBytes 50.0 Mbits/sec 0.005 ms 0/763 (0%)
    [ 5] 6.00-7.00 sec 5.96 MBytes 50.0 Mbits/sec 0.003 ms 0/763 (0%)
    [ 5] 7.00-8.00 sec 5.96 MBytes 50.0 Mbits/sec 0.004 ms 0/763 (0%)
    [ 5] 8.00-9.00 sec 5.96 MBytes 50.0 Mbits/sec 0.004 ms 0/763 (0%)
    [ 5] 9.00-10.00 sec 5.96 MBytes 50.0 Mbits/sec 0.003 ms 0/763 (0%)
    [ 5] 10.00-10.03 sec 0.00 Bytes 0.00 bits/sec 0.003 ms 0/0 (nan%)
    - - - - - - - - - - - - - - - - - - - - - - - - -
    [ ID] Interval Transfer Bandwidth Jitter Lost/Total Datagrams
    [ 5] 0.00-10.03 sec 0.00 Bytes 0.00 bits/sec 0.003 ms 0/7558 (0%)
    -----------------------------------------------------------
    Server listening on 5201
    -----------------------------------------------------------


    Accepted connection from 10.100.1.10, port 33604
    [ 5] local 10.100.1.20 port 5201 connected to 10.100.1.10 port 51396
    [ ID] Interval Transfer Bandwidth Jitter Lost/Total Datagrams
    [ 5] 0.00-1.00 sec 22.0 MBytes 185 Mbits/sec 0.002 ms 0/15397 (0%)
    [ 5] 1.00-2.00 sec 24.2 MBytes 203 Mbits/sec 0.002 ms 0/16901 (0%)
    [ 5] 2.00-3.00 sec 23.4 MBytes 196 Mbits/sec 0.002 ms 0/16363 (0%)
    [ 5] 3.00-4.00 sec 24.2 MBytes 203 Mbits/sec 0.001 ms 0/16935 (0%)
    [ 5] 4.00-5.00 sec 23.5 MBytes 197 Mbits/sec 0.002 ms 0/16402 (0%)
    [ 5] 5.00-6.00 sec 24.2 MBytes 203 Mbits/sec 0.002 ms 0/16929 (0%)
    [ 5] 6.00-7.00 sec 23.5 MBytes 197 Mbits/sec 0.002 ms 0/16441 (0%)
    [ 5] 7.00-8.00 sec 24.1 MBytes 203 Mbits/sec 0.002 ms 0/16882 (0%)
    [ 5] 8.00-9.00 sec 23.5 MBytes 197 Mbits/sec 0.001 ms 0/16416 (0%)
    [ 5] 9.00-10.00 sec 24.2 MBytes 203 Mbits/sec 0.001 ms 0/16908 (0%)
    [ 5] 10.00-10.04 sec 1.56 MBytes 368 Mbits/sec 0.001 ms 0/1088 (0%)
    - - - - - - - - - - - - - - - - - - - - - - - - -
    [ ID] Interval Transfer Bandwidth Jitter Lost/Total Datagrams
    [ 5] 0.00-10.04 sec 0.00 Bytes 0.00 bits/sec 0.001 ms 0/166662 (0%)
    -----------------------------------------------------------
    Server listening on 5201
    -----------------------------------------------------------
  • Hi Titus,
    Thanks for the response.
    First of all, the issue here is not general packet UDP packet loss in K2H between the EVMs.
    We are running our custom application on our custom boards. We have some PA configuration to forward some traffic to the DSP cores.
    We are losing UDP packets in burst time to time which we were able to detect using out of sequence counters. We investigated the application, then linux kernel for any packet drops and finally we establised the iperf test together with a FPGA probe to track the port and packet count. We are actually losing packet which we could not see the loss in FPGA at receive end and no loss reported in kernel.
    There could be some drop in the switch or after that. We would like to know if we have done something wrong in our setup or configuration. If so, where should we investigate?
    When we see UDP packet loss which is after the FPGA in our custom board which could be confirmed by probing at the receive end, could there be any issue in PA setup or global FDQ.
    1) Whether all the traffic those are sent to ethernet switch forwarded to the host CPU via PA?
    2) Can there be any issue setting up PA queue size?

    Regards
    Rams
  • Hello,

    I switched my kernel version from 3.10.72  which uses NetCP PA firmware rev 3.0.1.3 to an older kernel  version which uses NetCP PA firmware rev 3.0.1.2 and repeated iperf test with different bandwidth.  

    The test results with NetCP PA firmware rev 3.0.1.2 showed better results than 3.0.1.3 in terms of percentage drops from 15% to 0.6%.  But then, this issue is different from what I have reported earlier.  Here the packet drops are in Linux kernel with RcvbufErrors.  The RcvbufErrors increases if the UDP packet are smaller.

     iperf3 -c 192.168.0.104 -u -b 800M -l 600

    reports 30% loss whereas

     iperf3 -c 192.168.0.104 -u -b 800M

    reports 0.22% loss.

    These packet drops are in kernel with rcvBuf errors.

    The idea was to test older NetCP PA firmware rev 3.0.1.2 to rule out any issue with NetCP firmware.  But before that, kindly clarify whether any wrong packet streaming interface configuration can introduce packet drops.  If so, how can we check the packet drop counts at PA?

    Could you please clarify my previous posts also?

    Thanks

    Rams

  • Hello,

    Could you please provide your feedback?


    Thanks
    Rams
  • Hi Rams,
    Sorry for the delayed response on this.

    We are running our custom application on our custom boards. We have some PA configuration to forward some traffic to the DSP cores.
    I switched my kernel version from 3.10.72 which uses NetCP PA firmware rev 3.0.1.3 to an older kernel version which uses NetCP PA firmware rev 3.0.1.2 and repeated iperf test with different bandwidth.

    I'm not sure that why you are getting some different results with different PA firmware since we are getting good results in K2H EVM board.
    Let me try with that older kernel version which uses PA firmware 3.0.1.2.
    Could you please tell/share us what configuration you have done to forward traffic to the DSP cores, so that we can try to reproduce the issue on K2H EVM.
    Thanks for your understanding.
  • Hi Titu,

    We will send the configuration which we do on DSP. But before that, we wanted to do perform iperf tests with different bandwidth upto 1G with packet length of different sizes upto 1500 bytes.
    Also, we are awaiting your confirmation on the role of PA when forwarding packets to ARM.
    1) Is there any default configuration for PA for forwarding packets to ARM?
    2) Do we need to have any special flow control settings?
    3) If any packets are dropped after the Ethernet Switch, is that possible to get the packets dropped at PA

    It is confusing for us to follow the Keystone 2 documentation as it is extended from Keystone 1 which had only DSP cores and role of PA has been well documented. But when it comes for Keystone 2, it is not clear whether PA has default configuration for ARM for receiving all packets other than those filtered for the DSP cores. If there are any drops, how can we know

    Regards
    Rams
  • Hi,
    As per our observation, the packets were dropped at the switch. Unfortunately, there are no counters that indicate that packets were dropped at the switch.
    I tried to increase the interface-0 RX Queue depth from 128 to 512 and RX Buffer size from 4096 to 16K for testing purpose in kernel device tree k2hk-net.dtsi. I do not see any packet drops. This helps in solving the issue.

    interface0: interface-0 {
    rx-channel = "netrx0";
    rx-queue-depth = <512 512 0 0>;
    rx-buffer-size = <1536 16384 0 0>;
    efuse-mac = <0>;
    };

    Could you please clarify on the limitations on rx-queue-depth and rx-buffer-size. ? Will there be any other implications by increasing these values? Does rx-queue depth of 128 good enough to handle half Gig of burst traffic?

    Thanks
    Rams
  • Rams,

    See the device tree binding documentation in /Documentation/devicetree/bindings/keystone-net.txt of your Linux source. This document explains that these device tree settings are configuring the the number of descriptors in each receive queue as well as the size of the descriptors in each queue. Your new settings are increasing the number of descriptors in the two receive queues of interface 0 from 128 descriptors to 512 descriptors. Since this alleviates your dropping issue I'm led to believe that the packets were getting dropped (after being passed up all the way to the NETCP PKTDMA) due to your host core being too slow to service the incoming packets without overwhelming the 128 descriptor buffer.

    The path of a packet coming into the device is:

    RX at external Ethernet port -> Forwarded to host port 0 -> sent to the PA for classification -> sent to the NETCP PKTDMA -> data copied into a descriptor buffer and the buffer is placed on the RX queue -> OS or host core consumes the buffer from the RX queue -> OS or host core returns the buffer to be used again. 

    It appears that your packets were making it all the way up to the 'copy into a descriptor buffer' step and then when a descriptor/buffer wasn't available the packet was dropped. This is why the switch statistics weren't showing any dropped packets (only the first two steps above are handled by the switch) because from its perspective the packets were passed up the chain  to the PA with no errors.

    Jason Reeder

  • Hi Jason Reeder,

    Thanks a lot for your explanation. What is the maximum size of descriptor buffer? Is that fine to increase the buffer size to 512?

    Thanks
    Rams
  • Rams,

    I am more familiar with the low level hardware of this device and less familiar with how the Linux driver uses it.

    However, I would assume that you would not want your descriptor buffer size (rx-buffer-size) to be larger than your MTU in your system. It stands to reason that this would leave unused buffer space each time a packet was received.

    As far as the number of descriptors goes (rx-queue-depth), I don't think that 512 is an unreasonable number. The number of descriptors (rx-queue-depth) multiplied by the size of each descriptor buffer (rx-buffer-size) should be the amount of memory that is used by each queue. As long as you don't have a memory constraint somewhere then you should be fine.

    If that answer isn't sufficient I can try to ask someone more familiar with the Linux side to chime in.

    Jason Reeder
  • Hi Jason Reeder,

    Thanks a lot. 

    You indicated that the core/OS is slow in consuming packets. Here, the Linux network stack has to handle the packets and the network drivers are running in kernel context which has higher priority.  If the applications are slow in handling the packets, it will be dropped anyway by the kernel.  The issue is that the packets did not reach kernel.  Our assumption is that with default NETCP configuration, the packets should arrive network stack and should not be dropped in PA even during full load.   Dont you think this will be a general issue for all running linux on K2H when there are burst traffic with RX FDQ queue size as 128 in PA.   Our system was running with appox 10% load.  There were burst of packets in our system.  We enabled flow control and checked for pause frame counters.  But the bandwidth was around 300M.  and we have  MAC-MAC link (No MDIO).  When switch is able to handle the burst traffic which was less than half of the maximum bandwidth of 1G, I guess, the PA RX FDQ  size should be large enough to handle the maximum bandwidth of the link. I had raised this question in this post already which was not answered. If the RX queue size is 128, is that large enough to handle 1G of bandwidth with burst packet inflow?

    I have also asked on how to dump PA statistics.  Are there any counters that would point to us if there are packets drops in PA for what so ever reason.  We tried reading C1 and C2 statistics using the PA API paSysStats_t..

    None of these counters classify1.nIpDepthOverflow, classify1.nSilentDiscard, classify2.nSilentDiscard indicated drops at PA

    Can you point to me to the register which will indicate the packet drops in PA for this issue.

    It will be very useful if TI clarifies all the queries.

    Thanks
    Rams

  • Rams,

    Please see Figure 1-1 in section 1.4 of the NetCP User Guide (http://www.ti.com/lit/ug/sprugz6/sprugz6.pdf). The descriptors/buffers that you are modifying using the device tree would be to the left of the PKTDMA, completely outside of the NetCP itself. These buffers/descriptors are actually part of the Multicore Navigator system in the SoC (http://www.ti.com/lit/ug/sprugr9h/sprugr9h.pdf).

    So, from the perspective of the GbE Switch (Layer 2 hardware switch) there are no packets dropped because they all get passed along to the PA. From the perspective of the PA there are no packets dropped because they were all classified and forwarded on to the PKTDMA. This is why those statistics are both showing no packets drops.

    When there are no descriptors remaining in a free descriptor queue (we call this buffer starvation) then the PKTDMA has two choices: either drop the packet immediately, or retry the packet after a timeout period. This behavior is controlled by the RX_ERROR_HANDLING bit in the 'RX Flow N Configuration Register A' (section 4.2.4.1 http://www.ti.com/lit/ug/sprugr9h/sprugr9h.pdf). If this bit is set to 0 then the PKTDMA will drop packets as they arrive on the RX flow until a free descriptor becomes available. So, even if flow control is enabled, if RX_ERROR_HANDLING is set to 0 then packets will be dropped by the PKTDMA and no flow control frames would be sent. This is my theory on what is happening in your case with 128 descriptors in the FDQ. 

    I'll ask someone else on my team to comment on your Linux specific questions.

    Jason Reeder

  • Hi, Rams,

    The descriptors are used by PA to send to CPPI and PA would not have stats for it. To PA, the packet is received and considered delivered. 

    The current setting should be able to support 1K, may be up to 2K descriptors. Anything higher than that, the region-12 and pool-net may need to increase as well.

    Increasing descriptors seems to hide the issue, not to solve the issue. You should find out why your hardware/software can not meet TI's performance. You mentioned that you are only be able to get 300Mbps out of 1GbE. Our iperf performance can reach 960Mbps. What MCSDK release are you using and are you using TI's driver?

    Rex

  • Thanks Jason Reeder for giving more insight into the issue.

    Hello Rex,

    I completely agree that increasing the descriptors seems to hide the core issue and is not the solution.  I would like to clarify that we are able to get full bandwidth capacity  with iperf without losses when no applications are running.  I will repeat the tests and post the results.

    We are seeing issues when system is loaded while running custom applications.

    I am not sure how to simulate same conditions on Eval kit with iperf or other tool to generate burst traffic when there is normal traffic of 200M.

    I am trying to understand your statement "You should find out why your hardware/software can not meet TI's performance".  When packets are getting dropped inside K2H, how could be this be attributed to specific hardware issue or software application issue.

    Our tests show that there are no issues when we pump in upto 1G traffic and all that could be delivered without any issues till the K2 Switch. Even if you consider the situation during this issue,  the switch does not drop any packets.  There were no pause frames when flow control was enabled.  The packets are able to pass through the keystone switch without issues.  The packets are getting dropped in multicore navigator as pointed out by Jason Reeder and there seems to be buffer starvation.  At the consumption side, it is kernel driver (Using only TI driver, no custom drivers) which has to consume and pass it on to linux network stack and make up free descriptor for Multicore navigator.  There should not be any specific hardware issues or application software issues.  If the custom applications are slow and not grabbing packets, network stack will naturally drop the packets.  We do not see any packets getting dropped by linux kernel. Please correct me if I am wrong

    We use TI driver and MCSDK releases.

    We use 3_01_03_06 MCSDK  for MPM. 

     Our kernel version is from MCSDK 3.1.4 (K2_LINUX_03.10.72_15.08)

    Our U-Boot version is from K2_UBOOT_2013_01_15.02_01

  • Rams,

    What is the average size of the packets through ethernet port?

    Rex

  • Hi Rex,

    The average size of the packet is 512 bytes.

    Rams

  • Hi, Rams,

    There are several things we'd like to get clarification:

    1) Without any software running, just iperf, are you able to get close to 1Gbps performance on your boards?

    2) When you observed the UDP dropped, were there other ethernet port connected to the network? or just eth0?

    3) Can you explain why in your netstat stats that IP packets are 400K more than UDP? ICMP and TCP are only around 70 pakcets total. Does it mean that the other ethernet port was also connected to the network? If that is the case, then the UDP counts will be the combination of all ethernet ports and will be off from what FPGA expects to receive.

    4) Is the received packet coutns at FPGA close to the number of RX packets in ifconfig for that port?

    5) How does the FPGA receive packets from kernel?

    6) Kernel handles 64 packets (NAPI weight) per each Rx interrupt then returns these 64 descriptors back to the free queue. For each packet, it calls into application Rx function and this is in kernel context. Is it possible that the FPGA receive function is not returning the control back to kernel driver soon enough?

    Rex

  • Hi Rex,

    Please find answers inline.

    1) Without any software running, just iperf, are you able to get close to 1Gbps performance on your boards?

    Yes, you are right.  We are able to get close to 1Gbps when no application software is running.

    2) When you observed the UDP dropped, were there other ethernet port connected to the network? or just eth0?

    We are using only one ethernet port, port 0 which is directly interfaced to FPGA(PHYless configuration), No MDIO

    3) Can you explain why in your netstat stats that IP packets are 400K more than UDP? ICMP and TCP are only around 70 pakcets total. Does it mean that the other ethernet port was also connected to the network? If that is the case, then the UDP counts will be the combination of all ethernet ports and will be off from what FPGA expects to receive.

    We have enabled only one ethernet port which is interfaced to FPGA and configured in SGMII_LINK_MAC_MAC_FORCED mode.  

    4) Is the received packet coutns at FPGA close to the number of RX packets in ifconfig for that port?

    We tried match number of packets at FPGA close to the number of RX packets in the Switch statistics (ethtool -S eth0)

    5) How does the FPGA receive packets from kernel?

    FPGA is directly interfaced to eth0 and FPGA has unique ipadress

    6) Kernel handles 64 packets (NAPI weight) per each Rx interrupt then returns these 64 descriptors back to the free queue. For each packet, it calls into application Rx function and this is in kernel context. Is it possible that the FPGA receive function is not returning the control back to kernel driver soon enough?

    There is no FPGA driver component separately to handle receive/send.


    Thanks

    Rams

    P.S

    I am travelling and will be back to work on 8th Oct.  I will be able to send you a detailed block diagram if it is not clear.

  • Hi, Rams,

    We get even more confused with your answers.

    1) FPGA has unique IP address - is it not the same IP address assigned to eth0? If it is a different IP address, then how does that work? We have one MAC address on eth0 with 2 different IP addresses?

    2) FPGA is directly interfaced with eth0 - You will need to describe more details on how this work. Does it mean that FPGA gets packets directly from eth0? If that is the case, where is the Linux Kernel in the picture?

    3) There is no FPGA driver component separately to hanel receive/send - we will need to know how FPGA receive the packets from SoC. The way we understand the packet flow in Linux is that the UDP application opens a socket of a specific UDP port on a specific ethernet interface (IP address) which it listens to. Take iperf as an example which sits on top of the UDP stack listens to a UDP port of the eth0 IP address, and when UDP delivers the packets, iperf acts on them (bookkeeping, etc.). As I described in previous post, the kernel driver delivers packets in descriptors, 64 of them per interrupt. We'll need to know if the FPGA does not fit in this picture, how does it receive packets? If it receives directly (steals under IP stack) from eth0, then how is this done?

    Please note the ethtool stats in K2H are the combination of all NetCP ports including host port which should not be taken as a whole being the stats on the specific interface.  The Rx Packets from ifconfig is more accurate on the packets count on that interface.

    Rex

  • Hi Rex,

    Sorry for late response.  I was out of office.

    Please find the block diagram which shows how the FPGA is interfaced to CPU.

    Note that the FPGA and CPU have the same IP address, and the FPGA acts simply as a bridge. (The FPGA logic will receive packets on specific ports and everything else is forwarded directly to the CPU.)


    Our packet counter is right before the PCS. 

    Thanks

    Rams

  • Hi, Rams,

    If I understand the diagram correctly, the FPGA replaces the PHY on TI EVM, and if I recall correctly that there are 2 devices connected to the Backplane, So your set up should look like: 

       Keystone-II-A  ==SGMII==> FPGA-A ==> BackPlane ==> FPGA-B ==SGMII==> Keystone-II-B

    1) was iperf run between KS-II-A and KS-II-B which shows no packet loss? If not, is it from some other device send to BackPlane then to receiving KS-II-B?

    2) If packet loss is in FPGA-B, then we should look at the transmit side because the packets are not even reached the CPSW and Kernel in Keystone-II-B.

    3) What is the transmit packet count shown at the source application which generates the packets? in ifconfig of KS-II-A? and in FPGA-A?

    Rex

  • Hi Rex,
    Yes your understanding of setup is partially right. It may not be always Keystone to Keystone, there can be other senders in place of Keystone -II A also. The packets gets dropped in Keystone -II A/B receive.

    But I would like to remind you again that the issue was related NetCP dropping the packets. This has been established already as packets are there until FPGA B packet counter and also the Keystone -II B Switch. The packets are not seen by CPU and increasing the queue depth as described in my previous comment fixes the issue. Kindly refer to Jason Reeder's comment about the starvation of descriptors.
    The only issue at the moment is that whether the increase in descriptor queue depth is justified though it seems to fix the issue. And the packets are dropped in Keystone-II receive in NetCP, how can be other components of the system attributed or what other hardware issues can cause starvation of descriptors. Hope it is also clear to you that there is no kernel driver for FPGA as per your previous comment in the post.

    It is not possible to reproduce the issue with iperf on Keystone II EVM. Our problems of packet loss during iperf tests on the custom board are gone after the increase in RX queue depth. But we dont know whether this has other side effects. If so, we would like to know what can be other side effects?

    I agree that it is very handy if we could manage to reproduce the issues on K2HK EVM. But sometimes, it is very hard to run all our applications on EVM and simulate the load and traffic on EVM with iperf .

    Regards
    Rams
  • Rams,

    We understand your system better now. What we don't understand is why on TI EVM it can reach 960Mbps UDP throughput with default number of descriptors, but it can't on your system. Without reproducing it on TI EVM, it is impossible for us to work on the issue. If increasing the descriptor number can solve the issue, we suggest to adapter it as a workaround.

    Rex