This thread has been locked.
If you have a related question, please click the "Ask a related question" button in the top right corner. The newly created question will be automatically linked to this question.
Tool/software: TI C/C++ Compiler
Hi,
I want to test the radar FFT performance of the EVE processor by feeding it canned radar data instead of live data from radar chips.
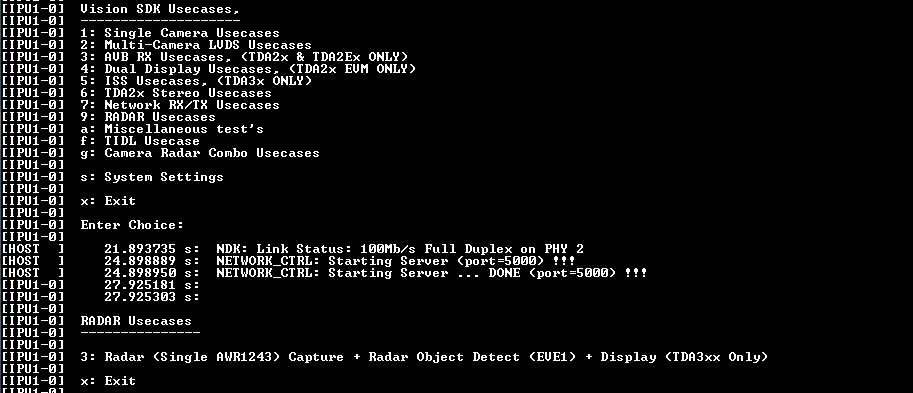
The radar demo menu code contains a usecase for a null source input + radar FFT + null output, but when I run the demo, this usecase does not show up on the serial terminal. Has this feature not been implemented yet, or do I have to explicitly specify this usecase when I build the program?
If this feature is not available yet, is it possible to use the link API to reroute the data flow manually from the radar capture + object detect + display usecase which is supported?
Thanks,
Richard
Hi Piyali,
I am developing with the Vision SDK, and the analogous file does not have an option for this usecase. I was under the impression that the Vision SDK is a superset of the Radar SDK, does the Radar SDK actually contain unique features?
I have set NDK_PROC_TO_USE=a15_0 and FATFS_PROC_TO_USE=ipu1_0.
I have not made any changes to the release.
Here is the serial terminal output when I run the demo:
Thanks,
Richard
Hi Piyali,
I switched to developing with the Radar SDK, and now I can run the null source input + radar FFT + null source output usecase. Following the steps in the user guide, I transmitted the sample radar binary file to the EVE processor and received the 2D FFT binary file back through the ethernet. I tried to view it by converting it from RGB 565 format to png, but the converter is unable to process the pixel format. In addition, the heat map depicted in the user guide does not show up on either the command prompt or the serial terminal.
How can I view the processed binary file and/or how do I display the heat map?
Attached is the binary output file:
And the associated console output from the network tool:
Thanks,
Richard
Hi Richard,
If you notice the usecase the output in RGB565 would be visible on the DSS output. The output of the network is the FFT magnitude values not converted to a displayable format. If you happen to have MATLAB and you can use this to see the bin file plotted as a 3 D plot of magnitude versus range versus doppler.
Can you try hooking up HDMI TV perhaps to the HDMI connector on the EVM to see the data live?
Thanks and Regards,
Piyali