This thread has been locked.

If you have a related question, please click the "Ask a related question" button in the top right corner. The newly created question will be automatically linked to this question.

AM3358: cold start problem

Expert 6460 points
Part Number: AM3358

Team,

this is continuation of the existing thread (linked here).

We are facing with a problem at booting. This issue was found at only one card so far, but we would like to know the background of it.

So I try to describe the problem:

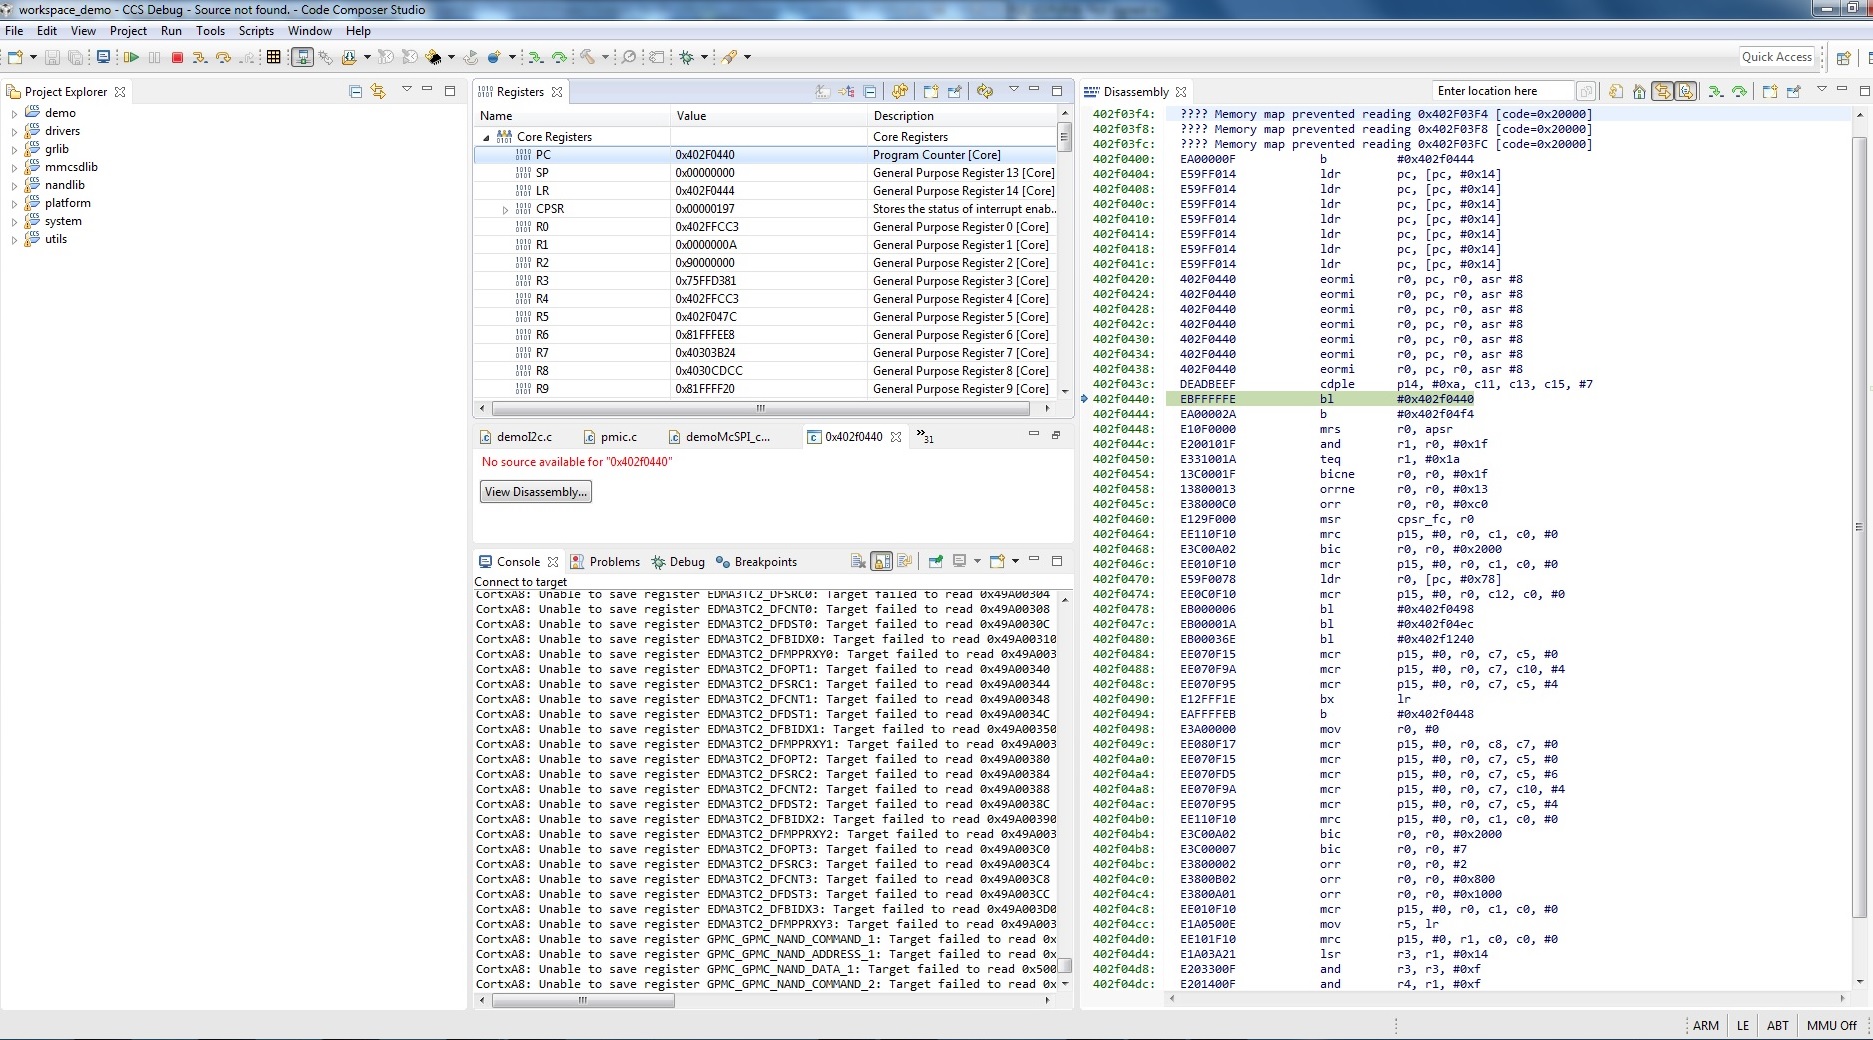
If the card is booting from the TFTP server through KSZ8463RL switch I have seen that the Program Counter is stuck at 0x402f0440 and hanging on this point (attached a picture about it below). I also attached the register values at this state.

I thought that this problem related to the DDR, but if I try to load the same (SPL and UBoot image) into serial port, the card will booting.

It seems that the problem appears only at first start, while the temperature of the card is about room temperature. The second boot is OK, if I am waiting for an hour to decrease the card temperature the problem will appear again.

I have just checked the voltages and the clocks of the Processor and the DDR and those seem to be OK, and after the reset the SYSBOOT[15:0] value is 1000 0000 0101 0000.

Can you please help solving this issue?

Thank you
TI Customer

cold-start-registers.txt

  • Bartosz,

    Please describe the hardware environment in detail. If possible, post the schematic.
  • Another question: Is this failure seen on a single board, or across multiple boards?
  • Hi Biser,

    I've sent you the description of the setup and schematic offline (confidential).

    So far the issue has been observed with one board.

    Kind regards,
    Bartosz

  • Is this only 1 board out of many? If so, I would suggest you check the board for manufacturing defects, esp. bad soldering.
  • By the way, the files you have sent are of no use. I was asking about the schematic in PDF format.
  • Biser,

    We don't see manufacturing defects on the board.

    The schematic in pdf has been sent to you now via e-mail.

    Kind regards
    Bartosz

  • Is this only 1 board out of many, or you see the issue on multiple boards?
  • Bartosz, as Biser alludes to, know how many boards has this issue is important to determine what kind of problem it is.

    Based on your screenshot, it looks like you are getting a data abort in MLO. A lot of times, this is a result of a mis-configured DDR. Since it is intermittent or maybe temp related, the configuration may be marginal.

    A couple of things you can try:
    -On a failing board, try opening up a memory window in the DDR memory to see if the values are still stable (hit the continuous refresh button)
    -Since you fail in MLO, you can put breadcrumbs in your code to determine how far you execute. Find a memory location in internal SRAM and just increment the value in different places in code. My suspicion is that the problem is happening during the loading of u-boot, when a lot of data is being transferred to DDR.
    -In your screenshot, i notice a couple of ARM core registers with addresses such as 0x81FFFEE8 and 0x81FFFF20. These look to be stack located in DDR. Immediately after a fail, open up a memory window to see if these values are stable.
    -In your screenshot, your SP is 0x00000000, which doesn't seem correct. May want to debug to try to understand why the stack pointer is being set to 0x0

    Regards,
    James
  • Hi James,

    thanks for your feedback. Please find the comments below, looking forward for your help.

    Kind regards,
    Bartosz

    Customer: I attach the trace vector, seen with debugger. Booting the card from the Ethernet source (SYSBOOT[15:0]=0x8050), the trace vector lowest value is 0xD03E, if the card boots from eMMC SYSBOOT[15:0]=0x8057 the trace vector value is 0x10009E.

    Note: If the warm- or cold reset or the PWR_EN of the PMIC signals are pulled to low, the problem is still remaining. I also checked the Core and the MPU voltages for the OPP100 boot mode.

    JJD said:

    Based on your screenshot, it looks like you are getting a data abort in MLO. A lot of times, this is a result of a mis-configured DDR. Since it is intermittent or maybe temp related, the configuration may be marginal.

    Could we configure the DDR in the MLO?

    JJD said:

    A couple of things you can try:
    -On a failing board, try opening up a memory window in the DDR memory to see if the values are still stable (hit the continuous refresh button) 

    It looks stable (picture attached in the zip). I cooled the card with cold spray.

    JJD said:

    -Since you fail in MLO, you can put breadcrumbs in your code to determine how far you execute. Find a memory location in internal SRAM and just increment the value in different places in code. My suspicion is that the problem is happening during the loading of u-boot, when a lot of data is being transferred to DDR.  

    It is hard to reproduce the problem. The "data abort exception" is what we have only found so far.

    JJD said:

    -In your screenshot, i notice a couple of ARM core registers with addresses such as 0x81FFFEE8 and 0x81FFFF20. These look to be stack located in DDR. Immediately after a fail, open up a memory window to see if these values are stable.  

    It also looks stabe (picture attached).

    JJD said:

    -In your screenshot, your SP is 0x00000000, which doesn't seem correct. May want to debug to try to understand why the stack pointer is being set to 0x0 

    If I click on the run it will reload the right value of the SP (picture attached).

    traces.zip

  • Hi James,

    would you share your thoughts?

    Thank you,
    Bartosz
  • Hi Bartosz, one important point to make is that when you try to boot using MLO and then inspect the results using CCS, ensure that you have all of the GEL files disabled or removed from your target configuration. In several of your screenshots, it looks like a GEL script has run, which will render any results you see in CCS useless.

    Can you retry some of the experiments above without the GELs? See if the memory window in DDR is stable after a crash. Can you also dump the EMIF registers after a boot from Ethernet and a boot from serial port, and compare the two.

    Regards,
    James
  • Bartosz, for further DDR analysis, can you use the DSS scripts described here: processors.wiki.ti.com/.../How_to_use_the_AM335x_IBIS_Models

    This will give us more information beyond just a register dump.

    Regards,
    James
  • Hi James,

    please see feedback from the engineer:

    1. I created a new target configuration as described in the link. Then I waited for an hour to fail in the MLO, the card tried boot from MMC. I attached the results of the DDR analysis and the Boot script (link), the files begin with 1.

    2. Then I connected to the card with the debugger for checking the DDR stable (attached the screenshot, begin with 2.) and exported the value of the EMIF (txt begin with 2.).

    3. I set the SYSBOOT pins to Eth boot configuration and waited an hour again to fail in the MLO, and I attached the results of the DDR analysis and the Boot script (the files begin with 3.).

    4. Then I connected to the card with the debugger again for checking the DDR stable (attached the screenshot, begin with 4.) and exported the value of the EMIF (txt begin with 4.).

    5. I attached the results of the DDR analysis and the Boot script (the files begin with 5.) after a normal boot from MMC

    6. I attached the results of the DDR analysis and the Boot script (the files begin with 6.) after a normal boot from Ethernet.

    Looking forward for your feedback.

    Thank you,

    Kind regards,
    TI Customer 

    3704.files.zip

  • Hi Bartosz, thanks for the information. The DDR analysis in step 1 and 3 is showing that the EMIF clock is disabled and the some of the DDR initialization didn't execute, yet in steps 2 and 4 when you connected the debugger, you could read the EMIF registers and everything looked fine. It still seems like the GEL scripts are running automatically when he connects the debugger. Can you confirm that no GEL scripts are loaded in the debugger?

    Also, when he can get the board to crash after an hour or so, can he continually get it to crash with successive reboots? If he can get it to fail consistently, then he may be able to step through his code with the debugger to determine where the fail occurs. It may take successive tries to narrow in on where the failure occurs.
    Another question: what is the source of his MLO? What codebase did they start with, and what modifications did they make?

    Regards,
    James
  • Hi James,

    It seems we have found the problem with breadcrumbs. In our own function in the MLO, we stored a variable in the DDR without initialization of the variable. The variable addressed the upper section of the DDR memory. It seems that the DDR stored the last value of the variable within an hour. After an hour the variable sometimes got changed to another "bigger" value and the memory addressing was wrong.

    Thank you for your great support!
  • Thanks for following up with this.

    James