Hi,
I have two questions about the range profile in SDK5.3. Would you pls help?
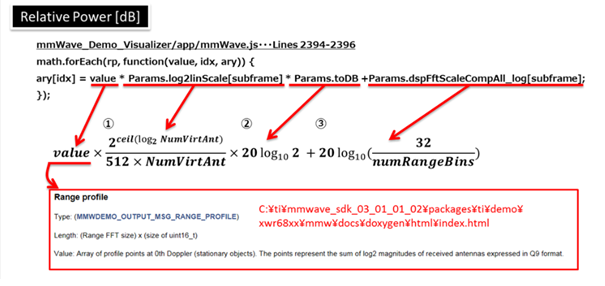
1. How to convert the range profile value output from serial port to dB which showed in above snapshot?
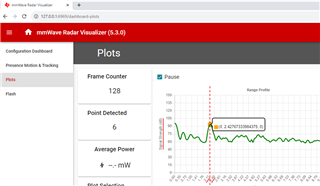
2. I think the x-axis is range (meter), but the wave seems not at the right location. From above snapshot, you will see the target is about 2.43m, but the peak of the wave is close to 2.11, instead of 2.46. Would you pls to check?
Thanks,
Chris