This thread has been locked.

If you have a related question, please click the "Ask a related question" button in the top right corner. The newly created question will be automatically linked to this question.

MMWCAS-RF-EVM: MIMO Range Azimuth heatmap axes not correct

Part Number: MMWCAS-RF-EVM

Hi,

I found that you append the first column of magnitude data to the end of the range azimuth magnitude matrix. The matrix is then transposed and flipped upside down. Does the appending of the first column to the end not cause the coordinates to be more closely spaced than they actually are? Here is the code:

mag_data_dynamic = squeeze(abs(radar_data_angle_range_dynamic(indices_1D+1,[1:end 1])));
mag_data_static = squeeze(abs(radar_data_angle_range_Static(indices_1D+1,[1:end 1])));


mag_data_dynamic = mag_data_dynamic';
mag_data_static = mag_data_static';
mag_data_dynamic = flipud(mag_data_dynamic);
mag_data_static = flipud(mag_data_static);

  • After removing the extra column, it seems that the coordinate spacing is the same but the x coordinates are

    shifted left 

  • Hi Dayalan,

    Does the appending of the first column to the end not cause the coordinates to be more closely spaced than they actually are?

    Can you please explain this in detail? (With an example maybe)

    Regards,

    Kaushik

  • Hi, 

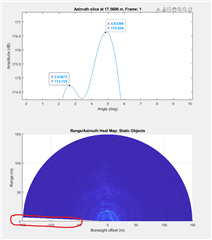
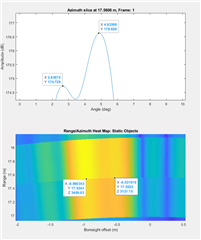
    This line: radar_data_angle_range_dynamic(indices_1D+1,[1:end 1]) appends the first column of radar_data_angle_range_dynamic the end of it i.e. the whole of radar_data_angle_range_dynamic is 1:end and column 1 is appended by [1:end 1]. If the append is not done, so [1:end], the graph below is generated. The top plot is an azimuth slice, so a semi circle from the range azimuth heatmap, where the axis is defined as:

    angleFFTSize = 2048;

    angle_resolution = 180 / angleFFTSize; % Resolution in degrees
    angleAx = -90:angle_resolution:(90-angle_resolution);

    Back-calculating the angle from the range azimuth heatmap coordinates for each target (two corner reflectors side by side) does not result in the same angle as those calculated using the code above.

    Here are two plots using [1:end]

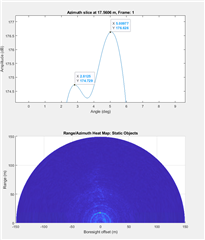
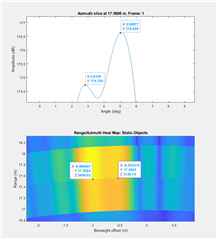
    Here is the original using Ti code:

  • Only the peaks in the top plots appear to change values. The code below is used to generate the top 2D plots, where target_rng_idx is the target's range bin:

    set(azimuthSlicePlot,'YData', 20*log10(mag_data_static(1:angleFFTSize, target_rng_idx)))