


Other Parts Discussed in Thread: TLV9004
Dear TI members,
measurement output result has min-max tolerance about 20% as below datasheet.

I think most measurement output result mostly distributed in typical value (2000 lux)
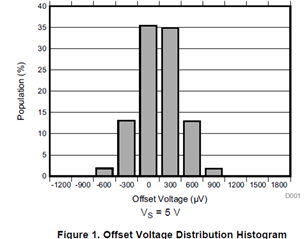
could you show me Distribution Histogram of measurement output result as below opamp data (TLV9004) ?
Best regards,
