Hi,
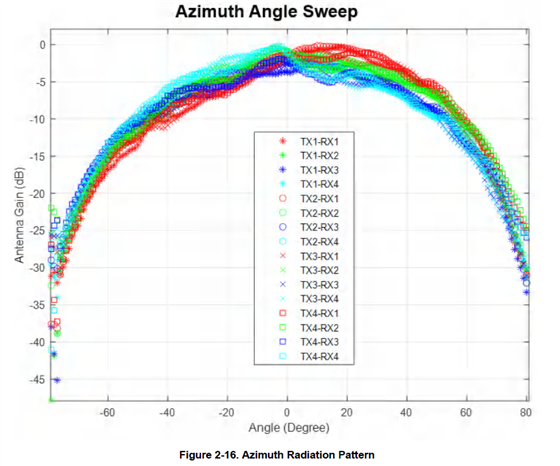
The plot below is from AWR2944 EVM user guide.
I assume this plot is made by Matlab code and the ADC raw data captured from DCA1000.
Could you provide us the Matlab code to generate this plot?

This thread has been locked.
If you have a related question, please click the "Ask a related question" button in the top right corner. The newly created question will be automatically linked to this question.
Hi,
The plot below is from AWR2944 EVM user guide.
I assume this plot is made by Matlab code and the ADC raw data captured from DCA1000.
Could you provide us the Matlab code to generate this plot?

Hi James,
I assume this plot is made by Matlab code and the ADC raw data captured from DCA1000.
Yes, antenna radiation pattern is plotted after post processing the raw ADC data.
Could you provide us the Matlab code to generate this plot?
MATLAB script used to generate this plot isn't provided by TI currently.
Regards,
Samhitha