This thread has been locked.

If you have a related question, please click the "Ask a related question" button in the top right corner. The newly created question will be automatically linked to this question.

AWRL6432BOOST: Visualizer not running, terminal keeps crashing

Part Number: AWRL6432BOOST
Other Parts Discussed in Thread: AWRL6432, DCA1000EVM, MMWAVE-L-SDK, CCSTUDIO

I downloaded MMWAVE_L_SDK_05_03_00_02-Windows and ti_xds110_setup_7.0.100.1_windows . But I am still unable to run low power visulaizer in the following file location: "C:\ti\MMWAVE_L_SDK_05_03_00_02\tools\visualizer\Low_power_visualizer_5.3.0.0". I can't even troubleshoot or diagnose this issue because every time I double click visualizer.exe, a terminal opens up and immediately crashes, so I am unable to catch the error.

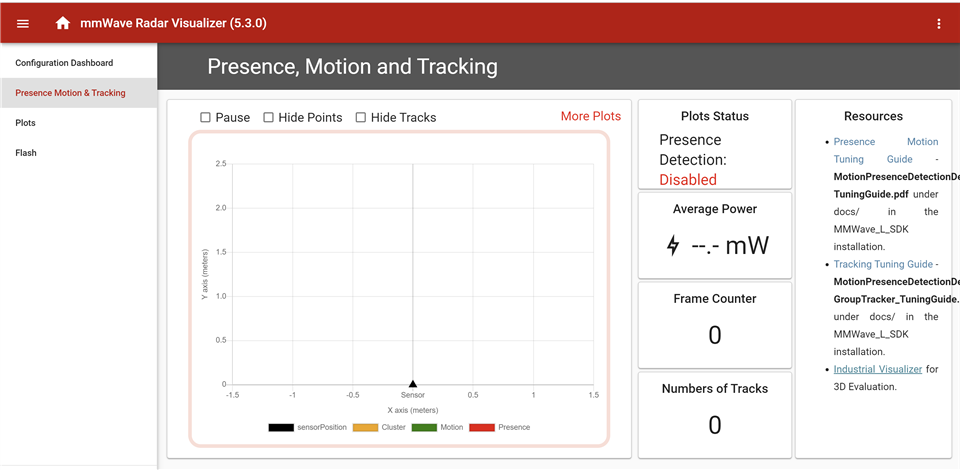
  • Ok, never mind. Had to run as administrator. But right now none of the buttons are working in configuration dashboard section of the visualizer and the presence motion and tracking section looks like this: 

    Why are the plots disabled and how to enable them?

  • Hi,

    Were you able to flash your device with the visualizer?

    Thanks,

    Clinton

  • Yeah, I did see the flash section. The issue was the default port selected in configuration dashboard. So the visualizer works now. Any idea how to get the raw data being sent to this visualizer?

  • Wrote this code in python based on that documentation:

    Fullscreen
    1
    2
    3
    4
    5
    6
    7
    8
    9
    10
    11
    12
    13
    14
    15
    16
    17
    18
    19
    20
    21
    import serial
    import serial.tools.list_ports as s
    import serial
    available_ports = list(serial.tools.list_ports.comports())
    for port, desc, hwid in available_ports:
    print(f"Port: {port}, Description: {desc}")
    # Configure the UART connection
    uart_port = 'COM7' # Replace with the correct port for your system
    uart_baudrate = 9600 # Set the baudrate to match the configuration of the evaluation board
    # Open the UART connection
    ser = serial.Serial(uart_port, uart_baudrate)
    # Enable the desired data outputs using CLI commands
    # Replace the following commands with the specific configuration you need
    cli_commands = [
    'sensorConfig --enabled=true',
    'rangeProfile --enabled=true',
    'detectedPoints --enabled=true',
    XXXXXXXXXXXXXXXXXXXXXXXXXXXXXXXXXXXXXXXXXXXXXXXXXX

    This is the output I got and it just hung afterward. Any idea what I am doing wrong?


  • Is code not the best way to get data. What would you recommend doing if I want to use raw data to enable some kind of triggers or cations to occur behind the scenes?

  • Hi,

    If you'd like to work in python, I'd recommend taking a look at the 'Industrial' visualizer. It's written in python and all the source is available in the Radar Toolbox. You can find it in the location below.

    C:\ti\radar_toolbox_1_30_01_03\tools\visualizers\Industrial_Visualizer

    Thanks,

    Clinton

  • I dont see a radar tool box folder just mmwave_l_sdk... and xds110

  • i finally understand what you are saying now and no I am not able to flash

  • i finally understand what you are saying now and I am not able to flash

  • Hi,

    Could you elaborate on what exactly you are referring to? What document are you following, what step are you at, what are you trying to flash?

    Thanks,

    Clinton

  • actually i can now, issue was baudrate. but i dont have the industrial visualizer

    https://www.ti.com/tool/download/RADAR-TOOLBOX/2.00.00.06 

    I see there is a link to download, but I dont see anything downloadable

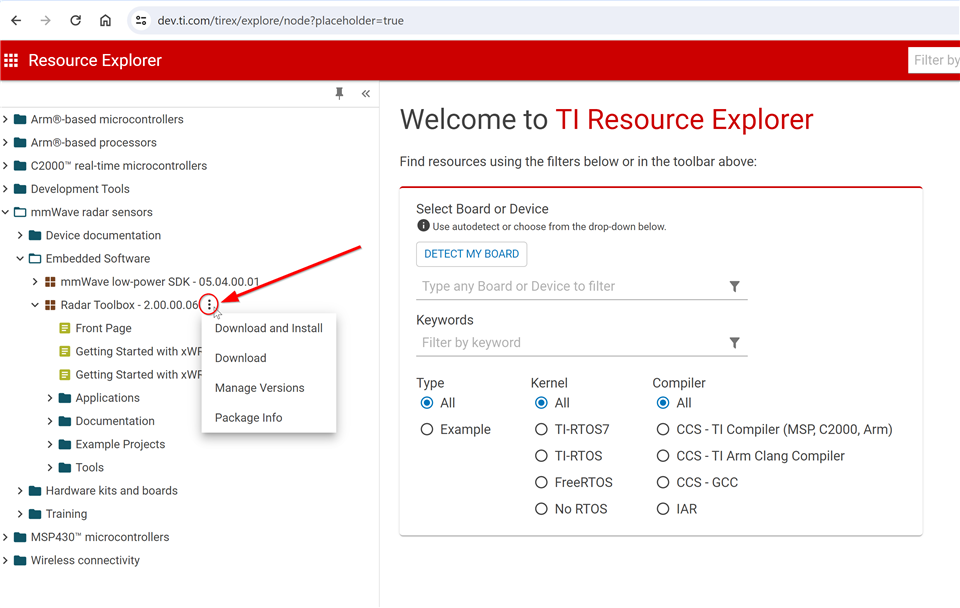
  • Try going here, then opening up the toolbox from there. A three dot menu button will give you the download option.

    https://dev.ti.com/tirex/explore/node?placeholder=true 

  • Is this what you were referring to:

    Fullscreen
    1
    2
    3
    4
    5
    6
    7
    8
    9
    10
    11
    12
    13
    14
    15
    16
    17
    18
    19
    20
    21
    import sys
    import os
    # add common folder to path
    # sys.path.insert(1, os.path.abspath(os.getcwd()) + "\\tools\\visualizers\\Applications_Visualizer\\common") # Uncomment for debug in VSCode or running from Applications_Visualizer dir
    sys.path.insert(1, '../common')
    # PyQt Imports
    from PyQt5.QtCore import Qt
    from PyQt5.QtWidgets import QApplication
    # Window Class
    from gui_core import Window
    # Demo List
    from demo_defines import *
    # Logging (possible levels: DEBUG, INFO, WARNING, ERROR, CRITICAL)
    import logging
    # Uncomment this line for logging with timestamps
    XXXXXXXXXXXXXXXXXXXXXXXXXXXXXXXXXXXXXXXXXXXXXXXXXX

    How do you use this code to get data off of ports?

  • Hi,

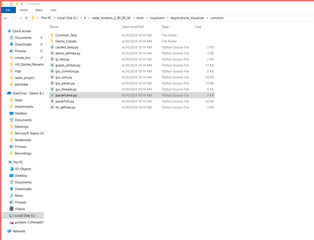
    If you go a level up, there is a 'common' folder with more of the source code.

    C:\ti\radar_toolbox_2_00_00_06\tools\visualizers\Applications_Visualizer\common

    Thanks,

    Clinton

  • I have been getting feedback that raw data capture is just not possible with AWRL6432BOOST on its own. Wanted to double-check that this is not the case?

  • Hi,

    I had thought you were interested in knowing more about the data being send over to the visualizer. Yes, you'll need a DCA1000 to perform the raw data capture. I've directly linked to the User's Guide and method comparison document below.

    https://dev.ti.com/tirex/content/radar_toolbox_2_00_00_06/docs/hardware_guides/dca1000_mmwave_studio_user_guide.html 

    https://dev.ti.com/tirex/content/radar_toolbox_2_00_00_06/docs/hardware_guides/raw_data_capture_tools_summary.html 

    Thanks,

    Clinton

  • "AWRL6432BOOST is an easy-to-use low-power 60GHz mmWave sensor evaluation kit for the AWRL6432 with an FR4-based antenna. This board enables access to point-cloud data and power-over-USB interfaces.

    AWRL6432BOOST supports direct connectivity to DCA1000EVM. The BoosterPack is supported by mmWave tools, demonstrations and software, including the mmWave software development kit (MMWAVE-L-SDK) and Code Composer StudioTm integrated development environment (IDE) (CCSTUDIO).

    Additional boards may be used to enable additional functionality. For example, DCA1000EVM enables access to sensor raw analog-to-digital (ADC) data capture. Onboard XDS110 enables software development via CCSTUDIO.

    AWRL6432BOOST can interface with the MCU LaunchPadTm development kit ecosystem."

    - Does this mean I need an additional board?

  • ohh i missed this

  • wait, but is there any way to get the data being sent over to the visualizer live? Because whatever data is being used to plot the graphs - that data is good enough for us

  • Do these files require that additional board?

  • or are there any other dependencies required to run this code?