This thread has been locked.

If you have a related question, please click the "Ask a related question" button in the top right corner. The newly created question will be automatically linked to this question.

OPT4048DTSEVM: Capturing data using python

Part Number: OPT4048DTSEVM
Other Parts Discussed in Thread: OPT4048

Tool/software:

Hi,

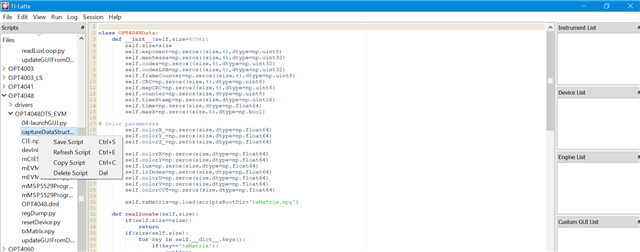
The device we have is working correctly, but we would like to have this device to be intgrated to our system that is build using python. I already looked at the GUI that is provided with the product but that contained some modules that I didn't find anywhere. It is also using python 2.x instead of 3.x which also causes some trouble with integration.

Would it be possible to get some kind of example code how we can save captured the data using python 3.x version?

  • Hi Jesper,

    Thank you for posting to the Sensing forum.

    Our EVM GUIs are built with Python 2 and unfortunately we do not have a Python 3 version available at this time. Can you provide more details about the testing automation that you need? It's possible to add scripts to the Latte GUI and automate aspects of your testing while using the built-in GUI functions, I just want to make sure that I understand the end goal.

    Best regards,
    Nicole

  • Hi Nicole,

    My end goal here is to be able to capture color values with the OPT4048DTSEVM of some light source and change the lightsource settings between captures. This way I could get corresponding color values/spectrum from the lightsource without having to change light source values manually and capture colors manually.

    Is it possible to get the source code for the connecting and capturing command for OPT4048DTSEVM and somehow make it work with python 3 for example?

    Alternatively, is it possible to add new (python 2 or 3) files to the EVM GUI (Latte software) that contains our light source controlling programs and use it with the built-in EVM GUI functions? 

  • Hi Jesper,

    Yes, it is possible to add new files to the EVM GUI. What are the control mechanisms of the light source you will be testing with?

    Depending on the control mechanisms, one option is to add a script to the OPT4048DTS software so that the light source can be controlled within Latte, and OPT4048 data collection can be automated alongside the light source. It is possible to copy/paste an existing script within the GUI and then edit it to control the light source.

  • The light source is controller by using socket and sending commands to the socket which then execute those commands and then it returns some light source parameter values from that socket.
    In sense of python code, it is simply a short class that uses socket and sends and receives parameters.

    Could you provide an example how could I add a simply script in that EVM GUI that contains a for loop which simpy captures 10 (of any number) shots at once, saves the data to csv file similarly as the UI does save the data (The only exception would be that the directory and the file name is given as a variable in the code and not asked each time when data is captured) and then it should do something (this would correspond chaning lighting conditions) and then repeat this until the loop ends?

    I would prefer a file but even a screenshot would be sufficient.

    Thanks in advance!

  • Hi Jesper,

    Attached is an example file that shows how to control the OPT4048 register settings and automate data streaming to a .csv file. You will be able to iterate across any desired test conditions (conversion time, light source setting, etc.) and set the number of samples saved for each conditions. 

    In order for this new script (named example_test_sweep.py) to be compatible with the OPT4048 GUI that you have, please replace the 04-launchGUI.py file with the attached (you can just copy/paste the new file into the existing GUI script).

    example_test_sweep.py
    # example script to automate OPT4048 EVM collection
    
    dev.OPERATING_MODE = 3 # placing the device in continuous mode (default state upon GUI launch is shutdown mode)
    convTimeList = [8, 9, 10, 11] # example of conversion times to cycle through (8: 100ms, 9: 200ms, 10: 400ms, 11: 800ms)
    dataDir='C:/Users/example_directory'
    for convTime in convTimeList:
    	dev.CONV_TIME = convTime # setting the OPT4048 conversion time in each for loop iteration
    	# all required device settings can be configured with the syntax dev.REGISTER_NAME
    	
    	# QtTest.QTest.qWait(5000) # set delay if needed (us)
    	
    	fileName = dataDir+'/OPT4048test_%d.csv'%(convTime) # set .csv save location and name accordingly for each conv time iteration
    	workSpaceWindow.saveToFileFromCommandLine(fileName) # begin GUI capture and stream to .csv file
    	while(workSpaceWindow.saveToFileSamplesCounter < 50): # save 50 samples per file
    		QtTest.QTest.qWait(200)
    	workSpaceWindow.stop() # end GUI capture
    	
    	capDev.clearBuffer() # clearing buffer at the end to prevent leftover data from being saved in the next .csv file

    04-launchGUI.py
    import serial 
    import array
    
    from pyqtgraph.Qt import QtGui, QtCore
    from pyqtgraph.Qt import QtTest
    
    import numpy as np
    import pyqtgraph as pg
    import time 
    from __builtin__ import True
    #from pyqtgraph.ptime import time
    
    pg.setConfigOption('background', 'w')
    pg.setConfigOption('foreground', 'k')
    
    ## Define a top-level widget to hold everything
    class windowGUI():
    	
    	def __init__(self):
    		#self.masterWidget.close()
    		#self.close()
    		#self.showFullScreen()
    		#super(windowGUI, self).__init__(QtGui.QWidget)
    
    		self.c0=0
    		self.captureRunning=False
    		self.dataTable=np.zeros((5,5),dtype=np.float64)
    		self.nPoints=2**10
    		self.timePlot=np.arange(-self.nPoints,0)+1
    		self.data=OPT4048Data(self.nPoints)
    		self.captureReferenceFlag=0
    		#self.timePlot=np.linspace(-self.nPoints*waitTime,0,self.nPoints+1)[1:]
    		#self.plotDistData=np.zeros(self.nPoints,dtype=np.float64)
    		#self.plotAmplData=np.zeros(self.nPoints,dtype=np.uint32)
    		#self.plotPhaseData=np.zeros(self.nPoints,dtype=np.uint32)
    		self.ptr = 0
    		self.lastTime = time.time()
    		self.fps = None
    		self.captureFailed = 0
    		self.saveToFileEnabled=False
    		self.saveToFileCompleted=False
    		self.refreshTimerDelay=10
    		
    		
    		self.saveToFileRecordCounter=0
    		self.saveToFileNumberCounter=0
    		self.saveToFileSamplesCounter=0
    		
    
    		self.timer = QtCore.QTimer()
    		#self.timerIllum = QtCore.QTimer()
    		
    		#self.timerForOneShot = QtCore.QTimer()
    		
    		self.estimatedPower=0.0
    		#self.deviceConversionTime=dev._CONV_TIME.readReg()
    		
    		
    		self.chColorList=['#AF0000','#00AF00','#000000','#0000AF']
    		
    		self.setupActiveChannels(4)
    
    		self.oneShotMode=False
    		self.oneShotCLKFreq=62500 # in Hz
    		self.maximumOneShotTime=1000*(0xFFFF)*1.0/self.oneShotCLKFreq
    		self.oneShotOverHeadTime=4.0 # in mS
    		self.CIEPlot=np.load(scriptsRootDir+'CIE.npy')[0]
    		self.setupGUI()
    		self.sleepFlag=False
    		self.sleepTime=0
    		self.sleepTimePrev=0
    		self.oneShotMode=False
    		#self.timer.start(25)
    
    		#self.dataTable=np.array(['Phase',0.0
    	def __del__(self):
    		self.stop()
    
    	def setupActiveChannels(self,activeChannels=1):
    		self.numberOfActiveChannels=activeChannels
    		capDev.setContinousReadByteCountMode(self.numberOfActiveChannels-1)
    		self.captureMode=self.numberOfActiveChannels-1
    		self.data.captureMode=self.captureMode
    		dev.INT_CFG=2
    		return
    			
    
    	def setupGUI_CaptureControl(self):
    		# Capture Control Setup
    		self.startBtn = QtGui.QPushButton('Start Capture')
    		self.startBtn.setToolTip('Start data capture')
    		self.stopBtn = QtGui.QPushButton('Stop capture')
    		self.stopBtn.setToolTip('Stop data capture')
    		self.captureModeList=[]
    		for c0 in np.arange(1,self.numberOfActiveChannels+1):
    			self.captureModeList.append('%d Channel'%c0)
    		#self.captureConfigList=['Host Master']
    		self.displayPointsList=['%d'%(1<<count) for count in np.arange(10,2,-1)]
    		
    		#self.configModeSelect = QtGui.QComboBox()
    		#self.configModeSelect.setToolTip('Configures if OPT3101 keeps master timing or the host')
    		self.captureChannelsSelect = QtGui.QComboBox()
    		self.captureChannelsSelect.setToolTip('Selects between different sensor configurations')
    		self.displayPointsSelect = QtGui.QComboBox()
    		self.displayPointsSelect.setToolTip('Selects number of points to display on the scrolling graph')
    		#self.configModeSelect.addItems(self.captureConfigList)
    		#print "Capture mode list is ",self.captureModeList
    		self.captureChannelsSelect.addItems(self.captureModeList)
    		self.captureChannelsSelect.setEnabled(False)
    		self.displayPointsSelect.addItems(self.displayPointsList)
    		self.saveToFileSelect=QtGui.QCheckBox()
    		self.saveToFileSelect.setToolTip('Check this item to save the captured data to a CSV file')
    		self.saveToFileCounterLabel=QtGui.QLabel('%010d'%self.saveToFileSamplesCounter)
    		self.saveToFileCounterLabel.setAlignment(QtCore.Qt.AlignRight | QtCore.Qt.AlignVCenter)
    		#self.saveToFileCounterSpinBox.lineEdit().setReadOnly(True)
    
    		
    		self.layoutCaptureControlsW= QtGui.QGridLayout()
    		#self.layoutCaptureControlsW.addWidget(QtGui.QLabel('Timing Mode Select'),0,0)
    		#self.layoutCaptureControlsW.addWidget(self.configModeSelect,0,1)
    		#self.layoutCaptureControlsW.addWidget(QtGui.QLabel('Capture Mode Select'),0,0)
    		#self.layoutCaptureControlsW.addWidget(self.captureChannelsSelect,0,1)
    		self.layoutCaptureControlsW.addWidget(self.startBtn,0,1,colSpan=2)
    		self.layoutCaptureControlsW.addWidget(self.stopBtn,1,1,colSpan=2)
    		self.layoutCaptureControlsW.addWidget(QtGui.QLabel('Display Sample Count'),2,0)
    		self.layoutCaptureControlsW.addWidget(self.displayPointsSelect,2,1)
    		self.layoutCaptureControlsW.addWidget(QtGui.QLabel('Set Save File Name'),3,0)
    		self.layoutCaptureControlsW.addWidget(self.saveToFileSelect,3,1)
    		
    		#display light source detection
    		#self.lightSourceDetection=QtGui.QLabel()
    		#self.lightSourceDetection.setText(self.lightSourceDetectionCalc())
    		#self.lightSourceDetection.setText('test')
    		
    		#light source ratio
    		
    		#self.displayLightSourceDetectionRatio=QtGui.QLabel()
    		#self.displayLightSourceDetectionRatio.setText(self.lightSourceDetectionRatio)
    		#self.displayLightSourceDetectionRatio.setText('%06.4f'%self.lightSourceDetectionRatio)
    		
    		#self.layoutCaptureControlsW.addWidget(QtGui.QLabel('Light Source Detection:'),5,0)
    		#self.layoutCaptureControlsW.addWidget(self.lightSourceDetection,5,1)
    		
    		#self.layoutCaptureControlsW.addWidget(QtGui.QLabel('Light Source Detection Ratio'),6,0)
    		#self.layoutCaptureControlsW.addWidget(self.displayLightSourceDetectionRatio,6,1)
    		
    		self.layoutCaptureControlsW.addWidget(QtGui.QLabel('File Sample Count'),4,0)
    		self.layoutCaptureControlsW.addWidget(self.saveToFileCounterLabel,4,1)
    		self.saveToFileCounterLabel.setToolTip('Counts the number of data points to be stored in file')
    		self.captureControlsW=QtGui.QGroupBox('Capture Controls')
    		self.captureControlsW.setLayout(self.layoutCaptureControlsW)
    		
    		self.layoutControlsW= QtGui.QGridLayout()
    		self.layoutControlsW.addWidget(self.captureControlsW,2,0)
    		self.layoutControlsW.addWidget(self.deviceControlsW,1,0)
    		
    		#self.layoutControlsW.addWidget(self.configHostW,2,0)
    		self.controlsW=QtGui.QGroupBox('Controls')
    		self.controlsW.setLayout(self.layoutControlsW)


    	def setupGUI_DeviceControl(self):
    		# Device Control Setup
    		self.deviceRangeList=['AGC']
    		for c0 in np.arange(9):
    			self.deviceRangeList.append('Range %d'%c0)
    			
    		self.deviceRangeSelect = QtGui.QComboBox()
    		self.deviceRangeSelect.setToolTip('Sets device mode as per the dropdown')
    		self.deviceRangeSelect.addItems(self.deviceRangeList)
    		#self.deviceRangeSelect.setCurrentIndex(0)
    		self.deviceConversionTimeSelect=QtGui.QComboBox()
    		self.deviceConversionTimeSelect.setToolTip('Select the device conversion time')
    		#self.conversionTimeListNumbers=[0.6,1,1.8,3.4,6.5,12.7,25,50,100,200,400,800]
    		#self.convertionTimeList=['600us - 09bits','1ms - 10bits','1.8ms - 11bits','3.4ms - 12bits','6.5ms - 13bits','12.7ms - 14bits','25ms - 15bits','50ms - 16bits','100ms - 17bits','200ms - 18bits','400ms - 19bits','800ms - 20bits']
    		self.conversionTimeListNumbers=[0.6,1,1.8,3.4,6.5,12.7,25,50,100,200,400,800]*4
    		#self.convertionTimeList=['26ms','50.8ms','100ms','200ms','400ms','800ms','1600ms','3200ms']
    		self.convertionTimeList=['6.5ms','12.7ms','25ms','50ms','100ms','200ms','400ms','800ms']
    		self.deviceConversionTimeSelect.addItems(self.convertionTimeList)
    		#self.deviceConversionTimeSelect.setCurrentIndex(8)
    		
    		
    		self.layoutDeviceControlsW= QtGui.QGridLayout()
    		self.layoutDeviceControlsW.addWidget(QtGui.QLabel('Mode Select'),0,0)
    		self.layoutDeviceControlsW.addWidget(self.deviceRangeSelect,0,1)
    		self.layoutDeviceControlsW.addWidget(QtGui.QLabel('Conv Time per CH'),1,0)
    		self.layoutDeviceControlsW.addWidget(self.deviceConversionTimeSelect,1,1)
    		
    		self.deviceControlsW=QtGui.QGroupBox('Device Controls')
    		self.deviceControlsW.setLayout(self.layoutDeviceControlsW)
    	
    	def setupGUI_OperationControl(self):
    		modeList=['PWRDN','Continuous']
    		
    		self.deviceOperationModeSelect = QtGui.QComboBox()
    		self.deviceOperationModeSelect.setToolTip('Sets device operation mode as per the dropdown')
    		self.deviceOperationModeSelect.addItems(modeList)
    
    		
    		self.layoutOperationControlsW= QtGui.QGridLayout()
    		self.layoutOperationControlsW.addWidget(QtGui.QLabel('Operation Select'),0,0)
    		self.layoutOperationControlsW.addWidget(self.deviceOperationModeSelect,0,1)
    		
    		
    		self.operationControlsW=QtGui.QGroupBox('Operation Controls')
    		self.operationControlsW.setLayout(self.layoutOperationControlsW)
    		self.layoutControlsW.addWidget(self.operationControlsW,0,0)
    		
    
    	def setupGUI_TableDisplay(self):
    		# Table show widget Setup
    		labelListV=[]
    		if(self.numberOfActiveChannels==1):
    			labelListV.append('Live')
    			labelListV.append('Mean')
    			labelListV.append('Std')
    			labelListV.append('Std(HPF)')
    			labelListV.append('SNR(bits)')
    			self.nTableItems=len(labelListV)
    		else:
    			for c0 in np.arange(1,self.numberOfActiveChannels+1):
    				labelListV.append('S%d Live'%c0)
    				labelListV.append('S%d Mean'%c0)
    				labelListV.append('S%d Std'%c0)
    				labelListV.append('S%d Std(HPF)'%c0)
    				labelListV.append('S%d SNR(bits)'%c0)
    			self.nTableItems=len(labelListV)/self.numberOfActiveChannels
    		labelListV.append('Sample')
    		labelListV.append('TimeStamp')
    
    		
    		labelListH=[]
    		labelListH.append('Light Level (lux)')
    		labelListH.append('ADC Codes')
    		labelListH.append('Codes(LSB)')
    		labelListH.append('Exp')
    		labelListH.append('Mantessa')
    		labelListH.append('Cnt')
    		labelListH.append('CRC')
    		labelListH.append('mCRC')
    
    		
    		self.tableW=QtGui.QTableWidget(len(labelListV),len(labelListH))
    		self.tableW.setToolTip('Data summary table to live data and selection section from scrolling plot')
    		self.tableW.setSortingEnabled(False)
    		self.tableW.setVerticalHeaderLabels(labelListV)
    		self.tableW.setHorizontalHeaderLabels(labelListH)
    		
    		
    		self.tableW.setEditTriggers(QtGui.QAbstractItemView.NoEditTriggers)
    
    		self.tableWCells=np.array([])
    		for c1 in np.arange(self.tableW.rowCount()):
    			for c2 in np.arange(self.tableW.columnCount()):
    				item=QtGui.QTableWidgetItem()
    				self.tableWCells=np.append(self.tableWCells,item)
    				self.tableW.setItem(c1,c2,item)
    				item.setTextAlignment(QtCore.Qt.AlignRight | QtCore.Qt.AlignVCenter)
    				
    		self.tableWCells=self.tableWCells.reshape(self.tableW.rowCount(),self.tableW.columnCount())
    
    		self.tableData=np.zeros(self.tableWCells.shape,dtype=np.float64)
    		self.tableData=np.ma.masked_array(self.tableData,mask=True)
    		self.tableFormat=np.zeros(self.tableData.shape,dtype=np.object)
    		#self.tableData.mask[:3,:]=False
    		self.tableData.mask[-1,0]=False
    		for c0 in np.arange(self.numberOfActiveChannels):
    			self.tableFormat[c0*self.nTableItems+0,0]='%06.4f' # Lux(live)
    			self.tableFormat[c0*self.nTableItems+1,0]='%06.4f' # Mean 
    			self.tableFormat[c0*self.nTableItems+2,0]='%06.4f' # Std
    			self.tableFormat[c0*self.nTableItems+3,0]='%06.4f' # Std(HPF)
    			self.tableFormat[c0*self.nTableItems+4,0]='%04.1f' # SNR (bits)
    			self.tableData.mask[c0*self.nTableItems:(c0*self.nTableItems+5),0]=False
    			
    			self.tableFormat[c0*self.nTableItems+0,1]='%07d' #  Codes
    			self.tableFormat[c0*self.nTableItems+1,1]='%010.2f'
    			self.tableFormat[c0*self.nTableItems+2,1]='%06.4f'
    			self.tableFormat[c0*self.nTableItems+3,1]='%06.4f'
    			self.tableData.mask[c0*self.nTableItems:(c0*self.nTableItems+4),1]=False
    
    			self.tableFormat[c0*self.nTableItems+0,2]='%07d' #  CodesLSB
    			self.tableFormat[c0*self.nTableItems+1,2]='%010.2f'
    			self.tableFormat[c0*self.nTableItems+2,2]='%06.4f'
    			self.tableFormat[c0*self.nTableItems+3,2]='%06.4f'
    			self.tableData.mask[c0*self.nTableItems:(c0*self.nTableItems+4),2]=False
    			
    			self.tableFormat[c0*self.nTableItems+0,3]='0x%1X' # EXponent
    			self.tableData.mask[c0*self.nTableItems+0,3]=False
    			
    			#self.tableFormat[1+6*c0,1]='0x%1X'
    			#self.tableFormat[1+6*c0,2]='0x%1X'
    			self.tableFormat[c0*self.nTableItems+0,4]='0x%05X'  #Mantessa
    			self.tableData.mask[c0*self.nTableItems+0,4]=False
    			#self.tableFormat[2+6*c0,1]='0x%05X'
    			#self.tableFormat[2+6*c0,2]='0x%05X'
    			self.tableFormat[c0*self.nTableItems+0,5]='0x%1X' # Counter
    			self.tableData.mask[c0*self.nTableItems+0,5]=False
    			#self.tableFormat[3+6*c0,1]='0x%1X'
    			#self.tableFormat[3+6*c0,2]='0x%1X'
    			self.tableFormat[c0*self.nTableItems+0,6]='0x%1X' # CRC
    			self.tableData.mask[c0*self.nTableItems+0,6]=False
    			
    			#self.tableFormat[4+6*c0,1]='0x%1X'
    			#self.tableFormat[4+6*c0,2]='0x%1X'
    			self.tableFormat[c0*self.nTableItems+0,7]='0x%1X' # MSPCRC
    			self.tableData.mask[c0*self.nTableItems+0,7]=False
    			#self.tableFormat[5+6*c0,1]='0x%1X'
    			#self.tableFormat[5+6*c0,2]='0x%1X'
    		self.tableFormat[-2,0]='0x%02x' # MSP Counter
    		self.tableFormat[-1,0]='0x%04x' # TimeStamp
    		#self.tableFormat[-1,1]='0x%02x'
    		#self.tableFormat[-1,2]='0x%02x'
    		self.populateTable()
    		self.tableW.resizeColumnsToContents()
    		
    
    	def setupGUI_LiveDisplayBox(self):
    		# Live display box setup
    		self.liveDisplayW=np.array([])
    		self.liveDisplayFormat=dict()
    		self.liveDisplayFormat[0]=""
    		self.liveDisplayFormat[1]=""
    	
    		for c0 in np.arange(self.numberOfActiveChannels):
    			self.liveDisplayFormat[0]+="<span style=\" font-size:12pt; font-weight:600; color:%s;\" > 0x%07x codes Exp:0x%01X Mantessa:0x%05X</span><br>"
    		self.liveDisplayFormat[0]+="<span style=\" font-size:8pt; font-weight:600; color:#000000;\" > USB Capture rate :%6.1f sps Display Refresh rate:%5.1f fps</span>"
    
    		self.liveDisplayFormat[1]+="<span style=\" font-size:12pt; font-weight:600; color:%s;\" > X  :%5.3f U:%5.3f</span><br>"
    		self.liveDisplayFormat[1]+="<span style=\" font-size:12pt; font-weight:600; color:%s;\" > Y  :%5.3f V:%5.3f</span><br>"
    		self.liveDisplayFormat[1]+="<span style=\" font-size:12pt; font-weight:600; color:%s;\" > Z  :%5.3f</span><br>"
    		self.liveDisplayFormat[1]+="<span style=\" font-size:12pt; font-weight:600; color:%s;\" > Lux:%9.3flux <br>CCT:%05dK </span><br>"
    
    		for c0 in np.arange(2):
    			lDW=QtGui.QTextEdit()
    			self.liveDisplayW=np.append(self.liveDisplayW,lDW)
    			self.liveDisplayW[c0].setReadOnly(True)
    			self.liveDisplayW[c0].setToolTip('Live data display window')
    		
    		#self.liveDisplayW.document().setDefaultFont(self.liveDisplayW.document().defaultFont().setFamily("Courier New"))
    	def setupGUI_PlotsWindow(self):
    		self.plot0W=pg.GraphicsLayoutWidget()
    		self.plot1W=pg.GraphicsLayoutWidget()
    		self.plot2W=pg.GraphicsLayoutWidget()
    
    		for c0 in np.arange(1,self.numberOfActiveChannels):
    			self.__dict__['axis0DistCh%d'%c0]=pg.AxisItem('left')
    			self.__dict__['viewBox0DistCh%d'%c0]=pg.ViewBox()
    			self.__dict__['viewBox0DistCh%d'%c0].setMouseMode(self.__dict__['viewBox0DistCh%d'%c0].RectMode)
    			self.plot0W.addItem(self.__dict__['axis0DistCh%d'%c0],row = 0, col = self.numberOfActiveChannels-1-c0,  rowspan=1, colspan=1)
    		
    		#self.viewBox1Ampl=pg.ViewBox()
    		#self.axis1Ampl=pg.AxisItem('left')
    		#self.viewBox1Ampl.setMouseMode(self.viewBox1Ampl.RectMode)
    		#self.plot1W.addItem(self.axis1Ampl,row = 0, col = 0,  rowspan=1, colspan=1)
    
    		self.plotLux=pg.PlotItem(title='Lux output')
    		self.plotLux.vb.setMouseMode(self.plotLux.vb.RectMode)
    		#self.plotCIEXY.showAxes(True)
    		self.plotLux.showGrid(x=True,y=True)
    		self.plotLux.getAxis("left").setLabel('Lux')
    		self.plotLux.getAxis("bottom").setLabel('Sample Count')
    		self.plotLuxLine=pg.PlotCurveItem(x=self.timePlot,y=self.data.lux ,pen=pg.mkPen(width=0.5, color='#000000'))
    		self.plotLux.addItem(self.plotLuxLine)
    		self.plot2W.addItem(self.plotLux)
    
    		self.plot0DistCh0=pg.PlotItem(title='Multi-plot Sensor Output')
    		self.viewBox0DistCh0=self.plot0DistCh0.vb
    		self.viewBox0DistCh0.setMouseMode(self.viewBox0DistCh0.RectMode)
    		self.plot0W.addItem(self.plot0DistCh0,row = 0, col = self.numberOfActiveChannels,  rowspan=1, colspan=1)
    		for c0 in np.arange(1,self.numberOfActiveChannels):
    			self.plot0W.scene().addItem(self.__dict__['viewBox0DistCh%d'%c0])
    			self.__dict__['axis0DistCh%d'%c0].linkToView(self.__dict__['viewBox0DistCh%d'%c0])
    			self.__dict__['viewBox0DistCh%d'%c0].setXLink(self.__dict__['viewBox0DistCh%d'%(c0-1)])
    			self.__dict__['axis0DistCh%d'%c0].setLabel('Codes (Ch %d)'%c0, color=self.chColorList[c0])
    		self.plot0DistCh0.getAxis("left").setLabel('Light in lux',color=self.chColorList[0])
    		self.plot0DistCh0.getAxis("bottom").setLabel('Sample Count',color='#000000')
    		self.plot0DistCh0.showGrid(x=True,y=True)
    		
    		
    		for cx,method in enumerate(['XY','UV']):
    			self.__dict__['plotCIE%s'%method] = pg.PlotItem(title='CIE %s'%method)
    			self.__dict__['plotCIE%s'%method].vb.setMouseMode(self.__dict__['plotCIE%s'%method].vb.RectMode)
    			#self.plotCIEXY.showAxes(True)
    			self.__dict__['plotCIE%s'%method].showGrid(x=True,y=True)
    			self.__dict__['plotCIE%s'%method].getAxis("left").setLabel('%s'%method[1])
    			self.__dict__['plotCIE%s'%method].getAxis("bottom").setLabel('%s'%method[0])
    			
    
    			cieImage = pg.ImageItem()
    			cieImage.setImage(self.CIEPlot['%s_Image'%method])
    			imageSize=self.CIEPlot['%s_Image'%method].shape[:2]
    
    			tr = QtGui.QTransform()  # prepare ImageItem transformation:
    			tr.scale(1.0/imageSize[0],1.0/imageSize[1])	   # scale horizontal and vertical axes
    			tr.rotate(-90) # move 256x256 image to locate center at axis origin
    			tr.translate(-imageSize[0], 0) # move 256x256 image to locate center at axis origin
    
    			cieImage.setTransform(tr)
    			self.__dict__['plotCIE%s'%method].vb.addItem(cieImage)
    			self.__dict__['plotCIE%s'%method].vb.setAspectLocked(True)
    
    			plotBBLine=pg.PlotCurveItem(x=self.CIEPlot['%s_blackBodyCord'%method][:,0],y=self.CIEPlot['%s_blackBodyCord'%method][:,1] ,pen=pg.mkPen(width=0.5, color='#000000'))
    			self.spectralLocusLine=pg.PlotCurveItem(x=np.append(self.CIEPlot['%s_spectral_locus'%method][:,0],self.CIEPlot['%s_spectral_locus'%method][0,0]),y=np.append(self.CIEPlot['%s_spectral_locus'%method][:,1],self.CIEPlot['%s_spectral_locus'%method][0,1]) ,pen=pg.mkPen(width=0.5, color='#000000'))
    
    			#self.plotScatterXY=pg.PlotCurveItem(x=[0,0.33],y=[0,0.33] ,pen=pg.mkPen(width=0.5, color='#000000'))
    			self.__dict__['plotScatter%s'%method] = pg.ScatterPlotItem(pxMode=True)
    			
    
    			self.__dict__['plotCIE%s'%method].addItem(cieImage)
    			self.__dict__['plotCIE%s'%method].addItem(self.spectralLocusLine)
    			self.__dict__['plotCIE%s'%method].addItem(plotBBLine)
    			self.__dict__['plotCIE%s'%method].addItem(self.__dict__['plotScatter%s'%method])
    
    			for label in self.CIEPlot['%s_blackBodyLabels'%method]:
    				isoTherm=pg.PlotCurveItem(x=self.CIEPlot['%s_isoTherms'%method][label][:,0],y=self.CIEPlot['%s_isoTherms'%method][label][:,1],pen=pg.mkPen(width=0.25, color='#000000'))
    				#loc=np.argwhere(label==self.CIEPlot['%s_blackBodyTemps'%method]).ravel()[0]
    				text = pg.TextItem('%sK'%label,color='#000000',anchor=(0.5,0.5))
    				text.setPos(self.CIEPlot['%s_isoTherms'%method][label][1,0],self.CIEPlot['%s_isoTherms'%method][label][1,1])
    				self.__dict__['plotCIE%s'%method].addItem(isoTherm)
    				self.__dict__['plotCIE%s'%method].addItem(text)
    
    			for label in self.CIEPlot['%s_spectral_labels'%method]:
    				tickLine=pg.PlotCurveItem(x=self.CIEPlot['%s_spectral_locus_displayLine'%method][label][0],y=self.CIEPlot['%s_spectral_locus_displayLine'%method][label][1],pen=pg.mkPen(width=0.25, color='#000000'))
    				#loc=np.argwhere(label==self.CIEPlot['%s_blackBodyTemps'%method]).ravel()[0]
    				text = pg.TextItem('%s nm'%label,color='#000000',anchor=(0.5,0.5))
    				text.setPos(self.CIEPlot['%s_spectral_locus_textLocation'%method][label][0],self.CIEPlot['%s_spectral_locus_textLocation'%method][label][1])
    				self.__dict__['plotCIE%s'%method].addItem(tickLine)
    				self.__dict__['plotCIE%s'%method].addItem(text)
    
    
    			self.__dict__['plotCIE%s'%method].disableAutoRange()
    			self.__dict__['plotCIE%s'%method].setAspectLocked(True,1.0)
    			if(cx==0):
    				self.__dict__['plotScatter%s'%method].addPoints(spots=[{'pos': (0.33,0.33) , 'data':0 , 'brush':'k', 'symbol': 'o', 'size': 10}])
    				self.__dict__['plotCIE%s'%method].setXRange(0,0.80)
    				self.__dict__['plotCIE%s'%method].setYRange(0,0.90)
    			else:
    				self.__dict__['plotScatter%s'%method].addPoints(spots=[{'pos': colorClass.xy2uv([0.33,0.33]) , 'data':0 , 'brush':'k', 'symbol': 'o', 'size': 10}])
    				self.__dict__['plotCIE%s'%method].setXRange(0,0.60)
    				self.__dict__['plotCIE%s'%method].setYRange(0,0.60)


    			#self.__dict__['subPlotCIE%s'%method] = self.plot1W.addPlot(row=0, col=cx)
    			self.plot1W.addItem(self.__dict__['plotCIE%s'%method])


    		#self.CIEXYPlotItem = pg.PlotItem(viewBox=cieXYViewBox)
    		
    		#self.plotScatterXY.addPoints({'pos': [0.33,0.33], 'data': 1, 'brush':'b', 'symbol': 'o', 'size': 10})
    		#self.plotScatterXY.setData(pos=[0.33,0.33])


    		#self.plotCIEUV = self.plot2W.addPlot(0,0,title='CIE UV')
    		#self.plotCIEUV.vb.setMouseMode(self.plotCIEUV.vb.RectMode)
    		#self.plotCIEUV.showGrid(x=True,y=True)
    		#self.plotCIEUV.getAxis("left").setLabel('V')
    		#self.plotCIEUV.getAxis("bottom").setLabel('U')
    		
    		#self.plot1Dist.showGrid(x=True,y=True)
    		#self.plot1Ampl.showGrid(x=True,y=True)
    		for c0 in np.arange(self.numberOfActiveChannels):
    			self.__dict__['plot0DistCh%dCurve'%c0]=pg.PlotCurveItem(x=self.timePlot,y=self.data.lux ,pen=pg.mkPen(width=0.5, color=self.chColorList[c0]))
    		
    		#self.plot1DistCurve=pg.PlotCurveItem(x=self.timePlot,y=self.data.lux ,pen=pg.mkPen(width=0.5, color='#0000ff'))
    		#self.plot1AmplCurve=pg.PlotCurveItem(x=self.timePlot,y=self.data.amplitude,pen=pg.mkPen(width=0.5, color='#ff0000'))
    		
    		for c0 in np.arange(self.numberOfActiveChannels):
    			self.__dict__['viewBox0DistCh%d'%c0].addItem(self.__dict__['plot0DistCh%dCurve'%c0])
    			self.__dict__['viewBox0DistCh%d'%c0].enableAutoRange(axis= pg.ViewBox.XYAxes, enable=True)
    		#self.viewBox1Dist.addItem(self.plot1DistCurve)
    		#self.viewBox1Ampl.addItem(self.plot1AmplCurve)
    		
    		#self.viewBox1Ampl.enableAutoRange(axis= pg.ViewBox.XYAxes, enable=True)
    		#v3.enableAutoRange(axis= pg.ViewBox.XYAxes, enable=True)
    
    		
    		#for c0 in np.arange(self.numberOfActiveChannels):
    		#self.__dict__['plot0DistCh%d'%(0)].addItem(self.plot0DistRegion,ignoreBounds=True)
    		labelStyle = {'color': '#000000', 'font-size': '10pt'}
    		self.plot0DistCh0.setLabel('bottom',"Sample Count",**labelStyle)
    		self.plot0DistCh0.setLabel('left',"Codes(Ch 0)",color=self.chColorList[0])
    
    		#for c0 in np.arange(self.numberOfActiveChannels):
    		#	self.__dict__['plot2ProxmityCh%dCurve'%c0]=pg.PlotCurveItem(x=self.proximityXFactor[c0],y=self.proximityYFactor[c0] ,pen=pg.mkPen(width=5, color='k'))
    		#	self.proximityCurves=np.append(self.proximityCurves,self.__dict__['plot2ProxmityCh%dCurve'%c0])
    		#	self.plot2Proximity.addItem(self.__dict__['plot2ProxmityCh%dCurve'%c0])
    			
    		#for c0 in np.arange(self.numberOfActiveChannels):
    		#	self.plot2Proximity.addItem(pg.PlotCurveItem(x=[0,15000*self.proximityXFactor[c0][0]],y=[0,15000*self.proximityYFactor[c0][0]], pen='k', brush='b', size=3))
    		#	self.plot2Proximity.addItem(pg.PlotCurveItem(x=[0,15000*self.proximityXFactor[c0][-1]],y=[0,15000*self.proximityYFactor[c0][-1]], pen='k', brush='b', size=3))
    
    		self.plotTabs=QtGui.QTabWidget()
    		self.plotTabs.addTab(self.plot1W,"CIE XY")
    		self.plotTabs.addTab(self.plot2W,"Lux Live")
    		self.plotTabs.addTab(self.plot0W,"Channel Live")
    		#self.plotTabs.addTab(self.plot1W,"Composite")
    		
    	def setupGUI(self):
    		
    		# Blocks setup
    		#self.setupGUI_configHostControl()
    		self.setupGUI_DeviceControl()
    		self.setupGUI_CaptureControl()
    		self.setupGUI_OperationControl()
    		#self.setupGUI_TableDisplay()
    		self.setupGUI_LiveDisplayBox()
    		self.setupGUI_PlotsWindow()
    		
    		# MAster Setup
    		self.masterSplitter = QtGui.QSplitter(QtCore.Qt.Horizontal)
    		self.leftSplitter = QtGui.QSplitter(QtCore.Qt.Vertical)
    		self.rightSplitter = QtGui.QSplitter(QtCore.Qt.Vertical)
    		
    		self.liveDisplaySplitter=QtGui.QSplitter(QtCore.Qt.Horizontal)
    		
    		self.leftSplitter.addWidget(self.controlsW)
    		#self.leftSplitter.addWidget(self.tableW)
    		
    		for c0 in np.arange(2):
    			self.liveDisplaySplitter.addWidget(self.liveDisplayW[c0])
    		self.rightSplitter.addWidget(self.liveDisplaySplitter)
    		self.rightSplitter.addWidget(self.plotTabs)
    		
    
    		self.masterSplitter.addWidget(self.leftSplitter)
    		self.masterSplitter.addWidget(self.rightSplitter)
    
    		self.layoutMasterW= QtGui.QHBoxLayout()
    		self.layoutMasterW.addWidget(self.masterSplitter)
    		
    		
    		self.masterWidget=QtGui.QWidget()
    		self.masterWidget.setWindowTitle('OPT4XXX Viewer')
    		self.masterWidget.setLayout(self.layoutMasterW)
    		self.masterWidget.resize(1600,768)
    		self.masterWidget.setMinimumWidth(768)
    		self.masterWidget.setMinimumHeight(670)
    		self.rightSplitter.setSizes([150,self.masterWidget.height()-150])
    
    		#self.leftSplitter.setSizes([
    		#self.leftSplitter.setSizes([int(self.masterWidget.height()*0.2), int(self.masterWidget.height()*0.8)])
    		#self.rightSplitter.setSizes([int(self.masterWidget.height()*0.2), int(self.masterWidget.height()*0.8)])
    		#self.masterSplitter.setSizes([int(self.masterWidget.width()*0.21), int(self.masterWidget.width()*0.79)])
    		#self.leftSplitter.setMinimumWidth(int(self.masterWidget.width()*0.21))
    		#self.leftSplitter.setMinimumHeight(self.leftSplitter.height())
    		self.leftSplitter.setStretchFactor(0,0)
    		self.leftSplitter.setStretchFactor(1,1)
    		self.rightSplitter.setStretchFactor(0,0)
    		self.rightSplitter.setStretchFactor(1,1)
    		self.masterSplitter.setStretchFactor(0,0)
    		self.masterSplitter.setStretchFactor(1,1)
    		
    		self.connectFunctions()
    		
    	def slot_captureChannelsChanged(self):
    		value=self.captureChannelsSelect.currentIndex()
    		self.setupActiveChannels(1<<value)
    		
    	def slot_deviceConverionTimeChanged(self):
    		#regConversionTime=dev._CONV_TIME.getValue()
    		capState=self.captureRunning
    		if(self.captureRunning):
    			self.pause()
    		convTime=self.deviceConversionTimeSelect.currentIndex()
    		self.deviceConversionTime=convTime+4
    		prevDevMode=self.deviceOperationModeSelect.currentIndex()
    		self.deviceOperationModeSelect.setCurrentIndex(0)
    		dev.CONV_TIME = self.deviceConversionTime
    		self.deviceOperationModeSelect.setCurrentIndex(prevDevMode)
    		value=self.conversionTimeListNumbers[self.deviceConversionTime]
    		
    		self.refreshTimerDelay=value*0.7*self.numberOfActiveChannels
    		if(self.refreshTimerDelay<10):
    			self.refreshTimerDelay=10
    		self.timer.setInterval(self.refreshTimerDelay)
    		if(capState):
    			self.resume()
    		capDev.setupOneShotTime(value,value)
    #self.reEvalDeviceCondition()
    		
    	def slot_deviceRangeSelectChanged(self):
    		selectedOption=self.deviceRangeSelect.currentIndex()
    		if(selectedOption==0):
    			rangeRegister=12
    		else:
    			rangeRegister=selectedOption-1
    		capState=self.captureRunning
    		if(self.captureRunning):
    			self.stop()
    		prevDevMode=dev._OPERATING_MODE.getValue()
    		dev.OPERATING_MODE=0
    		dev.RANGE=rangeRegister
    		dev.OPERATING_MODE=prevDevMode
    		if(capState):
    			self.start()
    			
    	def slot_displayPointsChanged(self):
    		selectedOption=self.displayPointsSelect.currentIndex()
    		self.saveToFileSelect.setEnabled(selectedOption<3)
    		newNPoints=(1<<(10-selectedOption))
    		self.data.reallocate(newNPoints)
    		if(newNPoints==self.nPoints):
    			return
    		if(newNPoints<self.nPoints):
    			self.timePlot=self.timePlot[-newNPoints:]
    		if(newNPoints>self.nPoints):
    			self.timePlot=np.arange(-newNPoints,0)+1
    		
    		self.plot0DistCh0.setRange(xRange=[-newNPoints,self.timePlot[-1]])
    		#self.plot1Dist.setRange(xRange=[-newNPoints,self.timePlot[-1]])
    		#self.plot1Dist.setRange(xRange=[-newNPoints,self.timePlot[-1]])
    		#self.plot0DistRegion.setRegion([-newNPoints/10,0])
    		self.nPoints=newNPoints
    		
    	
    	def slot_deviceOperationModeChanged(self):
    		value=self.deviceOperationModeSelect.currentIndex()
    		if(value==0):
    			self.startBtn.setEnabled(False)
    			self.stopBtn.setEnabled(False)
    			dev.OPERATING_MODE=0
    		else:
    			self.startBtn.setEnabled(True)
    			self.stopBtn.setEnabled(True)
    			dev.OPERATING_MODE=3
    			
    	def updatePlotW0Views(self):
    		for c0 in np.arange(1,self.numberOfActiveChannels):
    			self.__dict__['viewBox0DistCh%d'%c0].setGeometry(self.viewBox0DistCh0.sceneBoundingRect())
    		
    	def populateTable(self):
    		for c1 in np.arange(self.tableData.shape[0]):
    			for c2 in np.arange(self.tableData.shape[1]):
    				if(self.tableData.mask[c1][c2]):
    					self.tableWCells[c1][c2].setText('')
    					continue
    			#log('Format is [%d][%d] [%s] Value is [%d]'%(c0,c1,self.tableFormat[c0][c1],self.tableData.data[c0][c1]))
    				self.tableWCells[c1,c2].setText(self.tableFormat[c1,c2]%self.tableData.data[c1,c2])


    	def connectFunctions(self):
    		self.startBtn.clicked.connect(self.start)
    		self.stopBtn.clicked.connect(self.stop)
    		#self.plot0DistRegion.sigRegionChanged.connect(self.updateStatistics)
    		#self.configModeSelect.currentIndexChanged.connect(self.configModeChanged)
    		self.captureChannelsSelect.currentIndexChanged.connect(self.slot_captureChannelsChanged)
    		self.displayPointsSelect.currentIndexChanged.connect(self.slot_displayPointsChanged)
    		self.deviceOperationModeSelect.currentIndexChanged.connect(self.slot_deviceOperationModeChanged)
    		
    		
    		self.deviceRangeSelect.currentIndexChanged.connect(self.slot_deviceRangeSelectChanged)
    		self.deviceConversionTimeSelect.currentIndexChanged.connect(self.slot_deviceConverionTimeChanged)
    		
    		#self.deviceAvgFrameComboBox.currentIndexChanged.connect(self.deviceAvgFrameCountChanged)
    		self.timer.timeout.connect(self.update)
    		#self.viewBox1Dist.sigResized.connect(self.updatePlotW1Views)
    		self.viewBox0DistCh0.sigResized.connect(self.updatePlotW0Views)
    		self.saveToFileSelect.stateChanged.connect(self.saveToFileSelectChanged)
    		#self.configHostTimeBetweenShotsSpinBox.valueChanged.connect(self.reEvalDeviceCondition)
    		#self.configHostTimeDCYSpinBox.valueChanged.connect(self.reEvalDeviceCondition)


    	def saveToFileSelectChanged(self):
    		if(self.saveToFileSelect.checkState()):
    			fileName,_=QtGui.QFileDialog.getSaveFileName(None,"Save CSV file",scriptsRootDir+'/../data/',filter="CSV Files (*.csv)")
    			if(fileName==''):
    				return
    			try:
    				f=open(fileName,'w')
    				f.close()
    				self.saveToFileName=fileName
    				self.saveToFileEnabled=True
    				self.saveToFileCompleted=False
    				self.saveToFileSamplesCounter=0
    				self.start()
    			except:
    				errorMessage=QtGui.QErrorMessage(self)
    				errorMessage.showMessage("File doesnt have write permission... Please check directory permisions or choose another file")
    				#errorMessage.resize(500,250)
    		
    	def updateStatistics(self):
    		#windowR=self.plot0DistRegion.getRegion()
    		windowR=[0,0]
    		selectData=np.argwhere(np.logical_and(self.timePlot>windowR[0],self.timePlot<windowR[1]))
    		if(selectData.any()):
    			luxMean=self.data.lux[selectData].mean(0).ravel()
    			luxStd=self.data.lux[selectData].std(0).ravel()
    			luxHPFStd=(self.data.lux[selectData][1:]-self.data.lux[selectData][:-1]).std(0).ravel()/np.sqrt(2.0)
    			
    			codesMean=self.data.codes[selectData].mean(0).ravel()
    			codesStd=self.data.codes[selectData].std(0).ravel()
    			codesHPFStd=(1.0*self.data.codes[selectData][1:]-1.0*self.data.codes[selectData][:-1]).std(0).ravel()/np.sqrt(2.0)
    			
    			codesLSBMean=self.data.codesLSB[selectData].mean(0).ravel()
    			codesLSBStd=self.data.codesLSB[selectData].std(0).ravel()
    			codesLSBHPFStd=(1.0*self.data.codesLSB[selectData][1:]-1.0*self.data.codesLSB[selectData][:-1]).std(0).ravel()/np.sqrt(2.0)
    			
    		else:
    			luxMean=np.zeros(self.numberOfActiveChannels,dtype=np.float64)
    			luxStd=np.zeros(self.numberOfActiveChannels,dtype=np.float64)
    			luxHPFStd=np.zeros(self.numberOfActiveChannels,dtype=np.float64)
    			codesMean=np.zeros(self.numberOfActiveChannels,dtype=np.float64)
    			codesStd=np.zeros(self.numberOfActiveChannels,dtype=np.float64)
    			codesHPFStd=np.zeros(self.numberOfActiveChannels,dtype=np.float64)
    			codesLSBMean=np.zeros(self.numberOfActiveChannels,dtype=np.float64)
    			codesLSBStd=np.zeros(self.numberOfActiveChannels,dtype=np.float64)
    			codesLSBHPFStd=np.zeros(self.numberOfActiveChannels,dtype=np.float64)
    
    			
    		for c0 in np.arange(self.numberOfActiveChannels):
    			self.tableData.data[c0*self.nTableItems+1,0]=luxMean[c0]
    			self.tableData.data[c0*self.nTableItems+2,0]=luxStd[c0]
    			self.tableData.data[c0*self.nTableItems+3,0]=luxHPFStd[c0]
    			self.tableData.data[c0*self.nTableItems+4,0]=np.log2(codesLSBMean[c0]/codesLSBHPFStd[c0]) if (not codesLSBHPFStd[c0]==0) else 0.0
    			self.tableData.data[c0*self.nTableItems+1,1]=codesMean[c0]
    			self.tableData.data[c0*self.nTableItems+2,1]=codesStd[c0]
    			self.tableData.data[c0*self.nTableItems+3,1]=codesHPFStd[c0]
    			self.tableData.data[c0*self.nTableItems+1,2]=codesLSBMean[c0]
    			self.tableData.data[c0*self.nTableItems+2,2]=codesLSBStd[c0]
    			self.tableData.data[c0*self.nTableItems+3,2]=codesLSBHPFStd[c0]
    		#self.tableData.data[0][2]=distStd
    		#self.tableData.data[1][1]=phaseMean
    		#self.tableData.data[1][2]=phaseStd
    		#self.tableData.data[2][1]=ampMean
    		#self.tableData.data[2][2]=ampStd
    		self.populateTable()
    		
    	def pause(self):
    		self.timer.stop()
    		capDev.stopCapture()
    		self.captureRunning=False
    		QtTest.QTest.qWait(100)
    		capDev.clearBuffer()
    		self.conditionalSampleStart=0
    		
    	def resume(self):
    		capDev.clearBuffer()
    		QtTest.QTest.qWait(100)
    		capDev.startCapture()
    		self.captureRunning=True
    		self.timer.start(self.refreshTimerDelay)
    	
    	def start(self):
    		# turn off the EVM LED
    		regProg._controller.sendPacket('GPIOx13x1')
    		self.conditionalSampleStart=0
    		self.deviceConversionTime=dev._CONV_TIME.getValue()
    		self.timer.setInterval(self.refreshTimerDelay)
    		self.timer.start(self.refreshTimerDelay)
    
    		self.captureRunning=True
    		capDev.startCapture()
    		self.saveToFileSelect.setEnabled(False)
    		self.deviceOperationModeSelect.setEnabled(False)
    		if(self.saveToFileEnabled):
    			self.displayPointsSelect.setEnabled(False)
    			self.saveToFileRecordCounter=0
    			self.saveToFileNumberCounter=0
    			
    		
    	def stop(self):
    		# turn on the EVM LED
    		regProg._controller.sendPacket('GPIOx13x0')
    		self.captureRunning=False
    		capDev.stopCapture()
    		self.timer.stop()
    		self.captureFailed = 0
    		self.saveToFileSelect.setEnabled(True)
    		self.deviceOperationModeSelect.setEnabled(True)
    		
    		if(self.saveToFileEnabled and (not self.saveToFileCompleted)):
    			self.displayPointsSelect.setEnabled(True)
    			self.saveToFileSelect.setChecked(False)
    			self.saveToFileTempFiles()
    			self.saveToFileCSVFile()
    			self.saveToFileRecordCounter=0
    			self.saveToFileNumberCounter=0
    			self.saveToFileSamplesCounter=0
    			
    	def closeEvent(self, event):
    		if event.type() == QtCore.QEvent.Close:
    			self.stop()
    			
    # 	def lightSourceDetectionCalc(self):
    # 		if(self.data.codes[-1,3] - self.data.codes[-1,0] is not 0):
    # 			self.lightSourceDetectionRatio=float(self.data.codes[-1,1]) / (self.data.codes[-1,3] - self.data.codes[-1,1])
    # 			#self.ratioMean=self.data.lux[selectData].mean(0).ravel()
    # 		else:
    # 			self.lightSourceDetectionRatio=0.0
    # 
    # # 		if(self.data.codes[-1,3] is not 0):
    # # 			self.lightSourceDetectionRatio=float(self.data.codes[-1,3]) 
    # # 		else:
    # # 			self.lightSourceDetectionRatio=0.0
    # 			
    # 			
    # 		#if (self.lightSourceDetectionRatio < 0.44):
    # 			#self.lightSourceDetection.setText("Sunlight")
    # 			
    # # 		if(self.data.codes[-1,3] > 0.8e7):
    # # 			self.lightSourceDetection.setText('Sunlight')
    # 
    # 		if (self.lightSourceDetectionRatio > 0.38 and self.lightSourceDetectionRatio < 1.0):
    # 			QtTest.QTest.qWait(1000)
    # 			self.lightSourceDetection.setText('LED')
    # 		elif (self.lightSourceDetectionRatio < 0.19):
    # 			QtTest.QTest.qWait(1000)
    # 			self.lightSourceDetection.setText('Incandescent')
    # 		elif (self.lightSourceDetectionRatio > 0.23 and self.lightSourceDetectionRatio < 0.34):
    # 			QtTest.QTest.qWait(1000)
    # 			self.lightSourceDetection.setText('Halogen')
    # 		elif (self.lightSourceDetectionRatio > 1.3):
    # 			QtTest.QTest.qWait(1000)
    # 			self.lightSourceDetection.setText('Sunlight')
    # 
    # 	
    # # 		if (self.lightSourceDetectionRatio > 0.40 and self.lightSourceDetectionRatio < 0.45):
    # # 			self.lightSourceDetection.setText('Sunlight')
    # # 		elif (self.lightSourceDetectionRatio > 40):
    # # 			self.lightSourceDetection.setText('LED')
    # # 		elif (self.lightSourceDetectionRatio >= 11 and self.lightSourceDetectionRatio <= 40):
    # # 			self.lightSourceDetection.setText('CFL')
    # # 		else:
    # # 			self.lightSourceDetection.setText('Not Sunlight')
    			
    	def update(self, timeout=100):
    		if(self.sleepFlag):
    			now=time.time()
    			self.sleepTime=self.sleepTime-(now-self.sleepTimePrev)
    			self.sleepTimePrev=now
    			if(self.sleepTime<0):
    				self.sleepFlag=False
    		
    		data = capDev.capture()
    		if(data is None):
    			self.captureFailed+=1
    			if(self.captureFailed == timeout):
    				error('Capture data from EVM timed out -- no data received from EVM. Stopping capture.')
    				self.stop()
    			return
    		now=time.time()
    		self.captureFailed = 0
    		self.data.unpack(data,convTime=self.deviceConversionTime,captureMode=self.captureMode,time=now)
    		#self.plotPhaseData[-distance.shape[0]:] = phase
    		
    # 		self.lightSourceDetectionCalc()
    # 		self.displayLightSourceDetectionRatio.setText('%06.4f'%self.lightSourceDetectionRatio)
    		
    		self.plotScatterXY.setData(spots=[{'pos': (self.data.colorX[-1],self.data.colorY[-1]),'data':0}])
    		self.plotScatterUV.setData(spots=[{'pos': (self.data.colorU[-1],self.data.colorV[-1]),'data':0}])
    		#self.plotScatterXY.setData(x=[0,self.data.colorX[-1]],y=[0,self.data.colorY[-1]])
    
    		for c0 in np.arange(self.numberOfActiveChannels):
    			self.__dict__['plot0DistCh%dCurve'%c0].setData(x=self.timePlot,y=self.data.codes[:,c0])
    		self.plotLuxLine.setData(x=self.timePlot,y=self.data.lux)
    		#self.plot1DistCurve.setData(x=self.timePlot,y=self.data.distance)
    		#self.plot1AmplCurve.setData(x=self.timePlot,y=self.data.amplitude)


    		#self.updateStatistics()
    		#self.populateTable()
    		
    		self.ptr += 1
    		dt = now - self.lastTime
    		dataRate=data.shape[0]/dt
    		#print 'Data recieved is %d in time %g'%(data.shape[0],dt)
    		if self.fps is None:
    			self.fps = 1.0/dt
    		else:
    			s = np.clip(dt*3., 0, 1)
    			self.fps = self.fps * (1-s) + (1.0/dt) * s
    		self.lastTime = now
    			
    		self.liveDisplayW[0].setHtml(self.liveDisplayFormat[0]%(\
    		self.chColorList[0],self.data.codes[-1,0],self.data.exponent[-1,0],self.data.mantessa[-1,0],\
    		self.chColorList[1],self.data.codes[-1,1],self.data.exponent[-1,1],self.data.mantessa[-1,1],\
    		self.chColorList[2],self.data.codes[-1,2],self.data.exponent[-1,2],self.data.mantessa[-1,2],\
    		self.chColorList[3],self.data.codes[-1,3],self.data.exponent[-1,3],self.data.mantessa[-1,3],\
    		dataRate,self.fps))
    		self.liveDisplayW[0].setAlignment(QtCore.Qt.AlignCenter | QtCore.Qt.AlignVCenter)
    
    		self.liveDisplayW[1].setHtml(self.liveDisplayFormat[1]%(\
    		self.chColorList[0],self.data.colorX_[-1],self.data.colorU[-1],\
    		self.chColorList[1],self.data.colorY_[-1],self.data.colorV[-1],\
    		self.chColorList[3],self.data.colorZ_[-1],\
    		self.chColorList[2],self.data.lux[-1],self.data.colorCCT[-1]))
    		self.liveDisplayW[1].setAlignment(QtCore.Qt.AlignCenter | QtCore.Qt.AlignVCenter)
    		
    		if(self.saveToFileEnabled):
    			self.saveToFileRecordCounter+=data.shape[0]
    			self.saveToFileSamplesCounter+=data.shape[0]
    			self.saveToFileCounterLabel.setText('%010d'%self.saveToFileSamplesCounter)
    			if(self.saveToFileRecordCounter>0.9*self.data.size):
    				self.saveToFileTempFiles()
    	
    	def saveToFileTempFiles(self):
    		fileName=self.saveToFileName+'_%04d.npy'%(self.saveToFileNumberCounter)
    		#print "Savinf to file [%s]"%fileName
    		saveDict=self.data.__dict__
    		saveDict['recordLength']=self.saveToFileRecordCounter
    		np.save(fileName,np.array([saveDict]))
    		self.saveToFileRecordCounter=0
    		self.saveToFileNumberCounter+=1
    		
    	def saveToFileFromCommandLine(self,fileName):
    		f=open(fileName,'w')
    		f.close()
    		self.saveToFileName=fileName
    		self.saveToFileEnabled=True
    		self.saveToFileCompleted=False
    		self.saveToFileSamplesCounter=0
    		self.start()
    		
    		
    	def saveToFileCSVFile(self):
    		f=open(self.saveToFileName,'a')
    		prevCount=0
    		for c0 in np.arange(self.saveToFileNumberCounter):
    			
    			fileName=self.saveToFileName+'_%04d.npy'%(c0)
    			dataLoad=np.load(fileName)[0]
    			if(dataLoad['recordLength']<1):
    				continue
    			data=prevCount+np.arange(dataLoad['recordLength'],dtype=np.float64)
    			data=np.append(data,np.repeat(c0,dataLoad['recordLength']))
    			#print "Loading file [%s] -- [%d]"%(fileName,dataLoad['recordLength'])
    			header='Sample Count,TempFileCount'
    			format='%d,%d'
    			c1=2
    			#print "recordLengh is %d"%dataLoad['recordLength'] 
    			for key, value in dataLoad.iteritems():
    				if(key=='txMatrix'):
    					continue
    				if(type(value) is np.ndarray):
    					if(np.size(value)>3):
    						if(np.size(value.shape)==1):
    							data=np.append(data,value[-dataLoad['recordLength']:])
    							c1+=1
    							#print "Doing [%s][%d] data shape is "%(key,c1),value[-dataLoad['recordLength']:].shape
    							header+=',%s'%key
    							if(type(value[-1])==np.float64):
    							#if(key=='lux' or key=='time' or key=='fft'):
    								format+=',%f'
    							else:
    								format+=',%d'
    						else:
    							for c3 in np.arange(self.numberOfActiveChannels):
    								data=np.append(data,value[-dataLoad['recordLength']:,c3])
    								c1+=1
    								#print "Doing Array [%s][%d]"%(key,c1),value[-dataLoad['recordLength']:,c3].shape
    								header+=',%s_%d'%(key,c3)
    								if(type(value[-1,c3])==np.float64):
    							#if(key=='lux' or key=='time' or key=='fft'):
    									format+=',%f'
    								else:
    									format+=',%d'
    							
    			data=data.reshape(c1,-1).swapaxes(0,1)
    			prevCount+=data.shape[0]
    			if(c0==0):
    				np.savetxt(f,data,header=header,delimiter=',',fmt=format)
    			else:
    				np.savetxt(f,data,fmt=format,delimiter=',')
    		f.close()
    		self.saveToFileCompleted=True
    		self.saveToFileEnabled=False
    		
    		
    workSpaceWindow = windowGUI()
    workSpaceWindow.masterWidget.show()
    workSpaceWindow.deviceConversionTimeSelect.setCurrentIndex(4)
    workSpaceWindow.slot_deviceOperationModeChanged()
    workSpaceWindow.slot_deviceConverionTimeChanged()
    workSpaceWindow.slot_deviceRangeSelectChanged()
    workSpaceWindow.slot_displayPointsChanged()


    Let me know if this is what you need, and happy to answer any additional questions you may have.

    Best regards,
    Nicole

  • Thanks Nicole! That helped me to get it automated.

    Although, now I have separate question: Is it possible to install pandas library to the EVM GUI? If not then I can use numpy which seems to be there already, but would require some code modification on our end.

    Thanks in advance!

  • Hi Jesper,

    There are ways to install pandas in the EVM GUI but may require some workarounds, since Latte is already packaged. I will let you know on this and get back to you via email.

    Best regards,
    Nicole