Tool/software:
Hello,
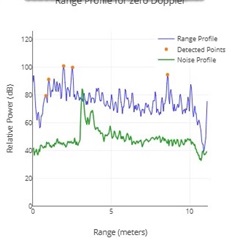
I have some questions about "range profile for zero doppler" graph on TI demo visualizer.
I observed the moving target and get the data with the AWR1843AOP.
(Please see the image. )

I'm setting 256 Range bins and 16 Doppler bins, and I use 3TX + 4RX antenna(virtual antenna is12).
1) How is the trace line of Range Profile on the graph displayed?
I think 12 range data (256 point) can be get, the number of virtual antennas.
However, there is only one line on the graph.
2) What does the peak of Noise profile on the graph indicate? (How is the peak of Noise Profile on the graph displayed?)
Is horizontal axis of Noise profile Range(meters)?
I initially thought it was Doppler peak, but there is no peak of Range profile on bin as same bin of the peak of Noise profile.
How should I think about this?
I already read the following thread but I still don't understand.
Please advise.
Best regards,
Shoko


