- Ask a related questionWhat is a related question?A related question is a question created from another question. When the related question is created, it will be automatically linked to the original question.
Tool/software:
Hello,
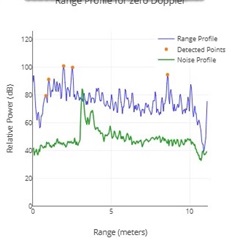
I have some questions about "range profile for zero doppler" graph on TI demo visualizer.
I observed the moving target and get the data with the AWR1843AOP.
(Please see the image. )

I'm setting 256 Range bins and 16 Doppler bins, and I use 3TX + 4RX antenna(virtual antenna is12).
1) How is the trace line of Range Profile on the graph displayed?
I think 12 range data (256 point) can be get, the number of virtual antennas.
However, there is only one line on the graph.
2) What does the peak of Noise profile on the graph indicate? (How is the peak of Noise Profile on the graph displayed?)
Is horizontal axis of Noise profile Range(meters)?
I initially thought it was Doppler peak, but there is no peak of Range profile on bin as same bin of the peak of Noise profile.
How should I think about this?
I already read the following thread but I still don't understand.
Please advise.
Best regards,
Shoko
Hi Shoko,
How is the trace line of Range Profile on the graph displayed?
What does the peak of Noise profile on the graph indicate? (How is the peak of Noise Profile on the graph displayed?)
Check the below screenshot.

Path to the document:
Regards,
Samhitha
Hello Samhitha,
Thank you for your response.
Regarding 1) The trace line of Range Profile on TI demo visualizer,
Zigang-san said "The "range profile for zero Doppler" is calculated as follows: 1) Take the zero Doppler output after range FFT and Doppler FFT/ 2) Combine the energy cross all antennas. " in the thread you provided.
"2) Combine the energy cross all antennas" means "Average the power cross all antennas", is it correct?
Regarding 2) The peak of Noise profile on TI demo visualizer, please answer the questions;
What does the peak of Noise profile on the graph indicate? (How is the peak of Noise Profile on the graph displayed?)
Is horizontal axis of Noise profile Range(meters)?
I initially thought it was Doppler peak, but there is no peak of Range profile on bin as same bin of the peak of Noise profile.
How should I think about this?
It seems that the peak of Noise profile occurs when the target has acceleration.
Please advise.
Regards,
Shoko
Hi Shoko,
Combine the energy cross all antennas" means "Average the power cross all antennas", is it correct?
It's sum of energy across all the antennas.
How should I think about this?
Please check the screenshot shared in the previous reply. It's the range profile at the last Doppler bin (maximum velocity).
Regards,
Samhitha
Hello Samhitha,
Thank you for your reply.
1) The trace line of Range Profile on TI demo visualizer
Regarding "Sum of energy across all the antennas", could you let me know the FORMULA?
2) The peak of Noise profile on TI demo visualizer
I can't understand the reason of the peak, just read the screenshot.
I think other users feel the same as me.
I know Noise profile is the range profile at the last doppler bin,
however I can't understand the mechanism that causes a peak on the Noise Profile trace.
In what scenes does a peak occur in the Noise Profile trace?
Please advise.
Thanks,
Shoko
Hi Shoko,
For range profile, range bins corresponding to the first doppler bin is taken from the detection matrix and transmitted over UART.
Check the following document for doppler processing - C:/ti/mmwave_sdk_03_06_02_00-LTS/packages/ti/datapath/dpc/dpu/dopplerproc/docs/doxygen/html/index.html
If you are looking for source code of doppler processing and detection matrix creation, refer to C:\ti\mmwave_sdk_03_06_02_00-LTS\packages\ti\datapath\dpc\dpu\dopplerproc\src\dopplerprocdsp.c.
In what scenes does a peak occur in the Noise Profile trace?
For stationary scene, there would be no objects or clutter at maximum speed so the range profile at such speed represents the receiver noise floor. If you are testing in non-static environment and there is an object moving at the maximum measurable velocity (detection in last doppler bin), you might observe that signal strength is high at the given range bin.
Regards,
Samhitha
Hello Samhitha,
Thank you for the information about Doppler Processing.
Please let me confirm to make sure.
- Range Profile: The first doppler bin, Combine the energy cross all Virtual antennas.
Amplitude (vertical axis) of Range Profile is calculated by the following formula;
FFT output (Amplitude of Range Profile) = 1/N' * sum(.)
FFT output (Amplitude of Range Profile) is Q8 format.
Where N' = 2^Ceil(Log2(N)), N = numVirtualAntennas. If N is 12, N' is 16.
- Noise Profile: The last doppler bin
Amplitude (vertical axis) of Noise Profile is same as Amplitude of Range Profile.
Please let me know if my understanding is correct.
Reagrds,
Shoko
Hi Shoko,
This seems to be correct understanding. After summation is computed for all the Doppler bins, you get the detection matrix which is transmitted over UART in the demo. You can convert the value to dB if needed (check the below screenshot).

Regards,
Samhitha