


Tool/software:
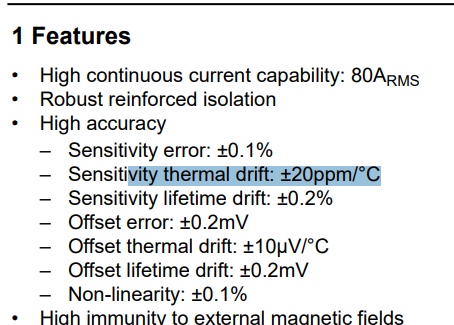
The sensitivity thermal drift shows +/-20ppm/degC, it means
20ppm/degC= (20/1e6)*190*100=+/-0.38%.
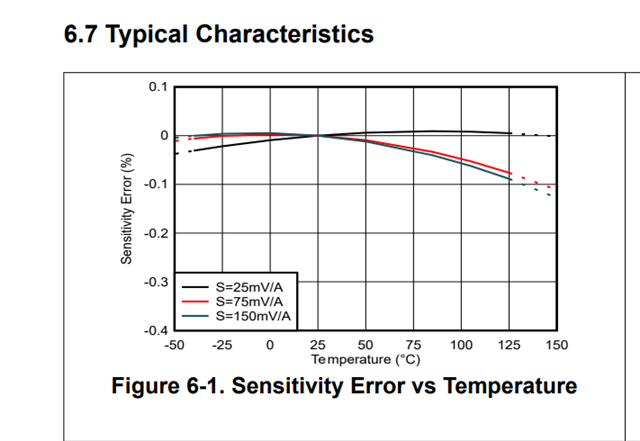
But the fig 6-1 shows it is only -0.1% error.
What's different?
Original question:

Tool/software:
The sensitivity thermal drift shows +/-20ppm/degC, it means
20ppm/degC= (20/1e6)*190*100=+/-0.38%.
But the fig 6-1 shows it is only -0.1% error.
What's different?

