Hello,
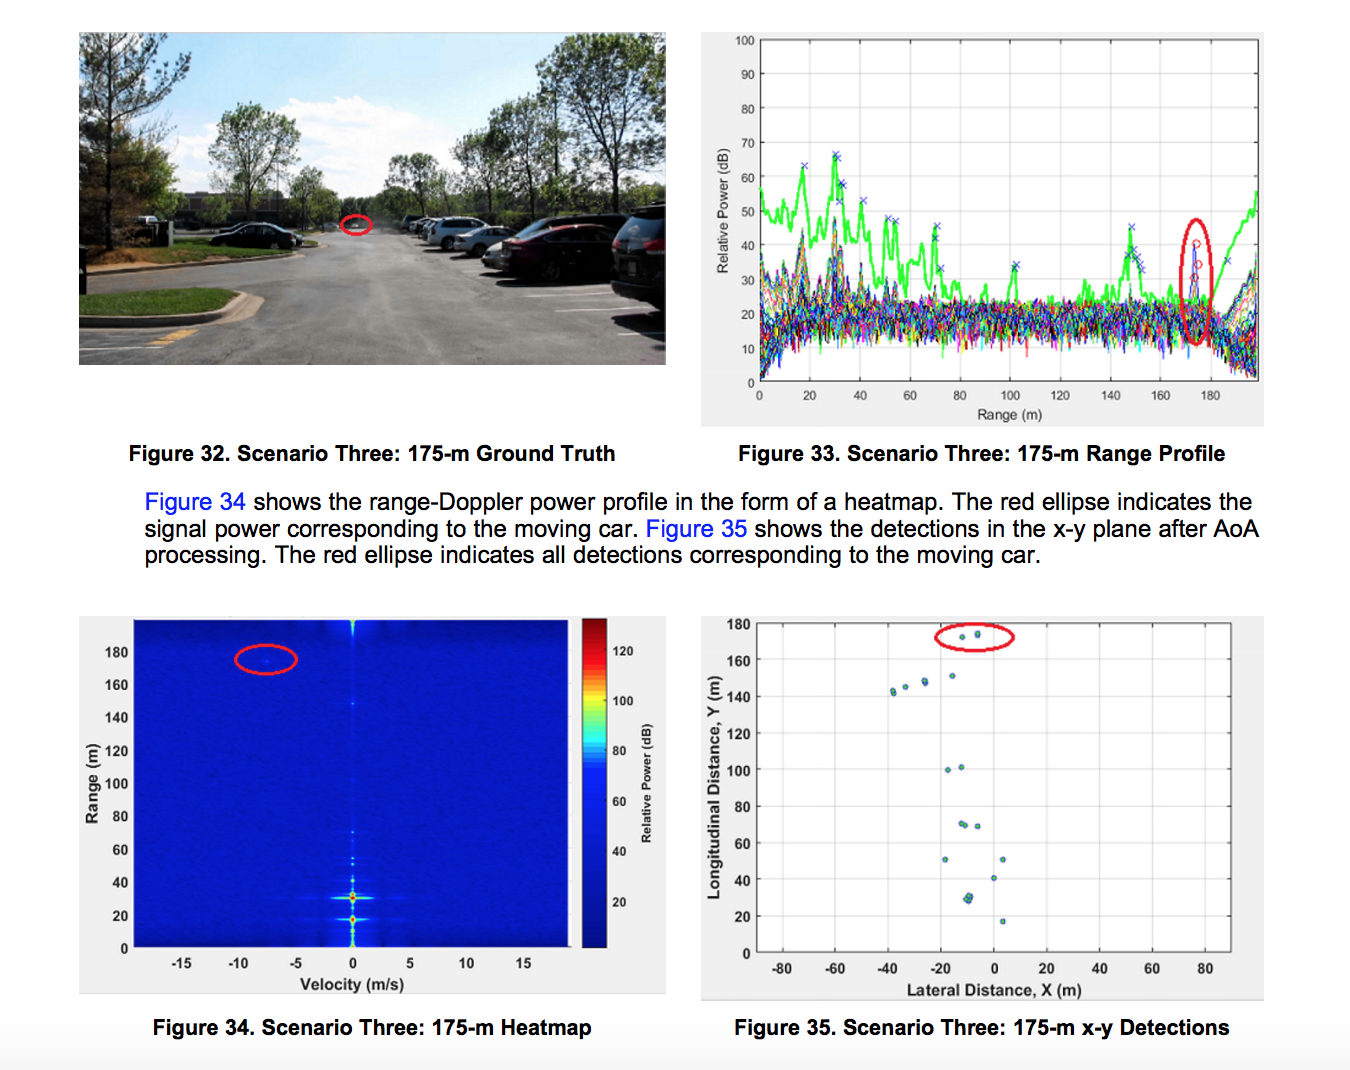
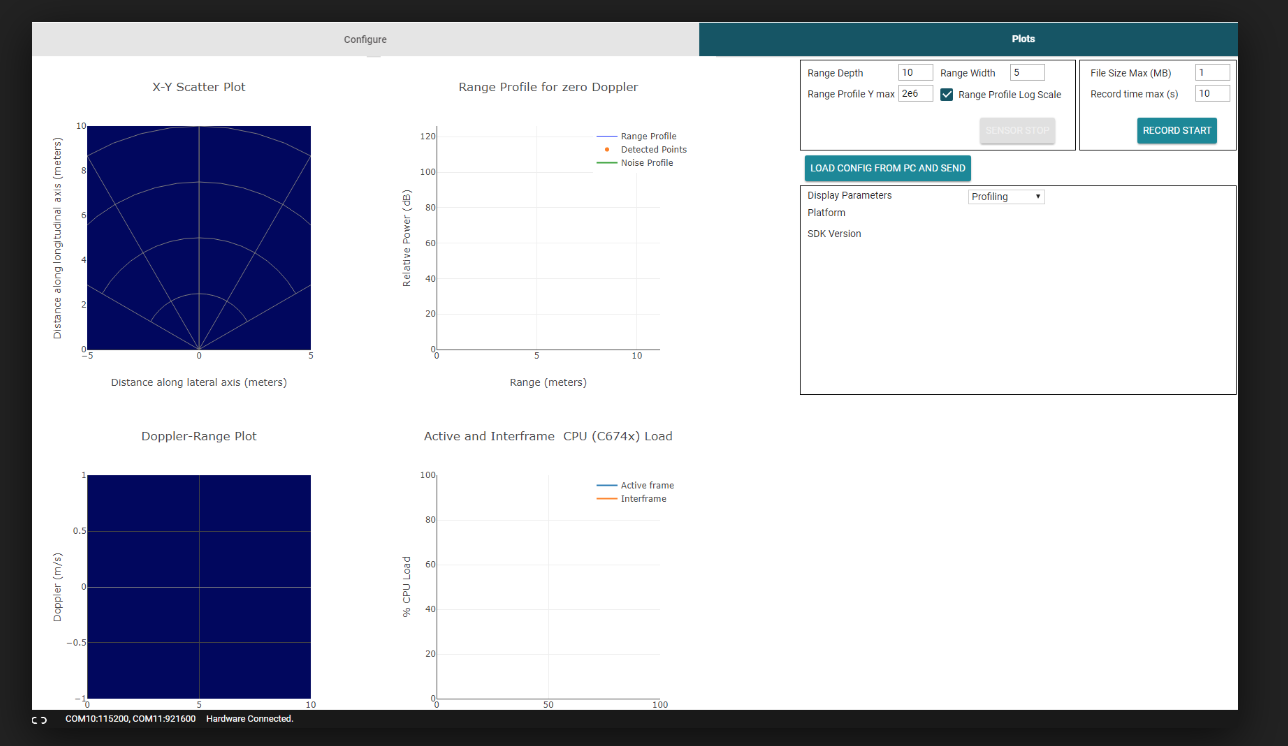
I am trying to find code to generate plots such as those found in the Traffic Monitoring Demo. Is there existing matlab code or documentation for generating these plots? Additionally I would like to get the source code to generate plots such as those found in the TI Demo Visualizer. Pictures of the plots I am trying to generate are found below. 
 (https://pdfs.semanticscholar.org/bcc7/da13c3d8c142b7a680180b9cc284954d9fde.pdf

