This thread has been locked.

If you have a related question, please click the "Ask a related question" button in the top right corner. The newly created question will be automatically linked to this question.

LDC1101: RCOUNT, resolution and sample rate

Part Number: LDC1101
Other Parts Discussed in Thread: LDC1614

Hello there,

I have question related to LDC1101 RCOUNT, corresponding sample rate and way to estimate resolution.

  • My design is wire winded coil which operates 0.05-0.1 target distance/coil diameter. Fref is 16MHz. 
  • Sensor operation frequency can be set to any value from 0.7-4 MHz. For best resolution I chose 0.8 MHz for middle of measurement range which gives (0.05 fsensor/fref). I believe that this is correct assumption.
  • Sensor frequency variation is 10-15% of LDC1101 supported frequency (9.5 MHz).

1. SAMPLE RATE

I need to have at least 10kHz sample rate. That gives me from equation 14 (snosd01d):

tconv = 100 usec (total time for conversion)

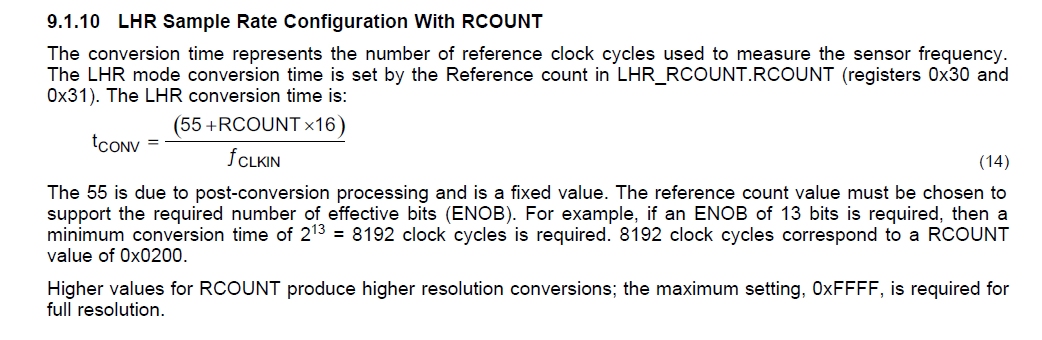
tpost_conv = 55/16MHz = 3.44 usec (fixed post process time)

tmeas = RCOUNT*16/16MHz =~ 96 usec (time left for measurement, HEX: 0x0060)

sample rate is then 1/tconv = 16000000 / ((3.44+96 * 16)) = 10.394 kHz.

This gives data latency (time from start of measurement to output data reading) 100 usec correct?

2. RCOUNT and RESOLUTION

I understand that with increasing sample rate the effective resolution decreases. Effective resolution is function f(RCOUNT, nominal fsensor, sensor variation,fsensor/fref).

In section LHR Sample Rate Configuration With RCOUNT is an example: 2^13 = 8192 clock cycles then there will be effective resolution will be 13 bits. RCOUNT is calculated as 8192 decimal (btw I believe that 8192 is in HEX: 0x2000 not 0x0200)


How do I get maximum effective resolution of 24 bits if RCOUNT can go just upto 65535?  RCOUNT varies 2^1 (6.5 bits) -> 2^16 (24 bits) but 2^13 is 13 bits?

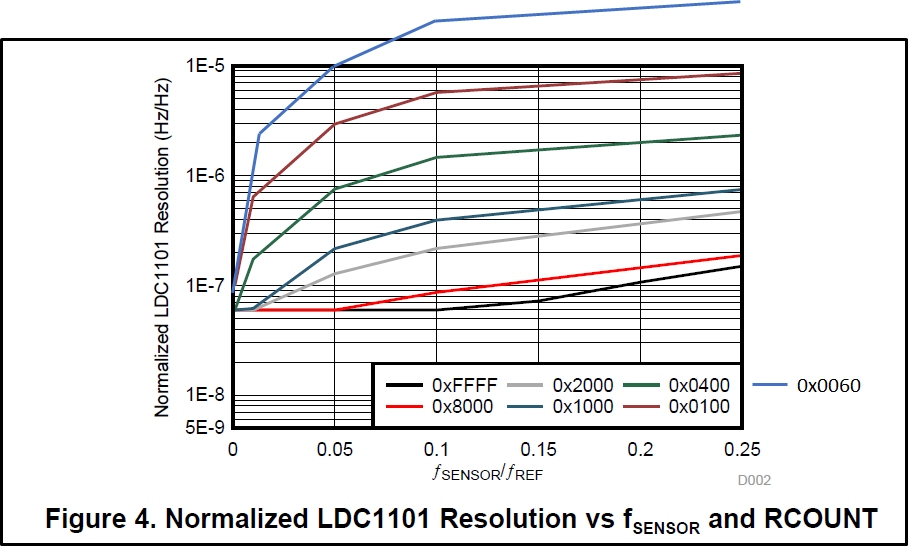
I also read manual snoa944 where on figure 4 is shown normalized resolution. I need to calculate resolution for RCOUNT 96.  What equation is behind this graph at figure 4?

When I extrapolate setting 0x0060 for fsensor/fref 0.05 I get approximate resolution of 1e-5 Hz/Hz which is for fref 16MHz 160Hz (1e-5*16*e6). If I assume that sensor frequency variation is 10% (0.95MHz) then entire resolution is 950000Hz/160Hz = 5937 values =~ 12.5 bits of resolution. Um resolution for range of measurement 2000 um = 2000/2^12.5  = 0.345 um correct?

How do I calculate frequency resolution for my case?

What would be the achievable resolution for setting RCOUNT 96 (10kHz) and how can I increase it with keeping same sample time?

I really appreciate your help.

Thank you,

Michael 

  • Hi Michael,

    Thank you for the detailed question and also the analysis. We will look into this. If you like to keep the sample time and the RCOUNT setting and to increase the resolution one variable to change would be the sensor frequency. Have you had a chance to look into the LDC Calculator tool that's online and had a chance to input various RCOUNT and analyze the results ? 

  • Hello Arjun,

    if I increase sensor frequency then ratio of fsensor/fref also increases (reference freq set to max - 16MHz). Resolution will then decrease based on figure 4.

    What I understand it is best to keep sensor frequency as low as possible in order to get better resolution even that frequency variation decreases. I also observed that the sensor at lower frequencies  (0.6-1.5 MHz) has better repeatability then same sensor tuned to higher frequencies.

    I am looking forward to your answers.

    thanks,

    Michael 

  • Hi Michael,

    Based on my research here are the steps to improve resolution. Which is also being discussed on this thread. https://e2e.ti.com/support/sensors/f/1023/t/906232#pi320995=1

    These are the main ways to improve resolution:

    • Maximize the inductive target's response
      • Use a highly conductive target at least three skin depths thick
      • Minimize the distance between the target and the sensor coil
      • Size the target at least as large as the sensor coil
    • Use a reference oscillator with the maximum frequency that the LDC device supports
      • Also minimize the oscillator's jitter and drift over temperature
    • Use the slowest possible sample rate

    Based on the resolution optimization app note keeping the sensor frequency low helps with getting better resolution. 

    For optimization of the RCOUNT based on teh sensor design I would recommend you use our Excel tool LDC Calculator 

  • Hello Arjun,

    thanks for the recommendations. We are going to make a product from the LDC1101. If I do not have enough information it will not be approved for further development. 

    • Maximize the inductive target's response - already have, aluminum
    • Use a highly conductive target at least three skin depths thick - few inches thick
    • Minimize the distance between the target and the sensor coil - it is less then 0.1''
    • Size the target at least as large as the sensor coil - I use three time bigger than coil diameter
    • Use a reference oscillator with the maximum frequency that the LDC device supports - I use maximum of 16 MHz oscillator, stable 2.5 ppm
    • Also minimize the oscillator's jitter and drift over temperature - until now tested only in constant temperature
    • Use the slowest possible sample rate - I decreased it already to slowest possible rate.

    Mainly I need to know:

    • How was the graph in manual snoa944 on figure 4 created? I need to calculate resolution for RCOUNT 90.  What equation is behind this graph at figure 4?
    • How do I get maximum effective resolution of 24 bits if RCOUNT can go just upto 65535?  RCOUNT varies 2^1 (6.5 bits) -> 2^16 (24 bits) but 2^13 is 13 bits?
    • When I extrapolate setting 0x0060 for fsensor/fref 0.05 I get approximate resolution of 1e-5 Hz/Hz which is for fref 16MHz 160Hz (1e-5*16*e6). If I assume that sensor frequency variation is 10% (0.95MHz) then entire resolution is 950000Hz/160Hz = 5937 values =~ 12.5 bits of resolution. Um resolution for range of measurement 2000 um = 2000/2^12.5  = 0.345 um correct?

    Would it be possible to speak with one of the designer of the LDC1101 or with someone who worked on SNOA944?

    Thank you for your answers.

    Michael

  • Hi Michael,

    Here are the responses.

    How was the graph in manual snoa944 on figure 4 created? I need to calculate resolution for RCOUNT 90.  What equation is behind this graph at figure 4?

    A) We dont have specific equation on how the graph that was generated. The information in the document is as is. The data was taken with different Fsensor frequencies with a fixed Fref and measurements were made and summarized with results with varies RCOUNT. 

    How do I get maximum effective resolution of 24 bits if RCOUNT can go just upto 65535?  RCOUNT varies 2^1 (6.5 bits) -> 2^16 (24 bits) but 2^13 is 13 bits?

    A) A higher RCOUNT value will certainly increase the resolution. If there is limitation on the RCOUNT the other option to increase the resolution is decrease the sensor frequency. In the graph 4. For RCOUNT = 0xffff at 0.1 fsensor/fref the resolution is < 1e-7 Hz

    When I extrapolate setting 0x0060 for fsensor/fref 0.05 I get approximate resolution of 1e-5 Hz/Hz which is for fref 16MHz 160Hz (1e-5*16*e6). If I assume that sensor frequency variation is 10% (0.95MHz) then entire resolution is 950000Hz/160Hz = 5937 values =~ 12.5 bits of resolution. Um resolution for range of measurement 2000 um = 2000/2^12.5  = 0.345 um correct?

    A) As the equation to compute isn't present, I cant comment on the extrapolation. Based on the resolution you can achieve that seems correct in terms of the distance measurement. 

    Datasheet graph figure 59 also provides guidance on the um resolution as a function of RCOUNT. 

    Can you please help us describe more on the application and your target accuracy you are trying to achieve ? 

  • Hello Arjun,

    I see that data in Figure 4 (snoa944) are made of experimental measurement.

    Yes I saw Figure 59 in datasheet with setting 0x00FF.  It can achieve sub micron resolution when fsensor / fref is under 0.1. My RCOUNT setting is 0x005A which is even less time for conversion. The only way is then to keep sensor frequency as low as possible with respect to reference frequency.

    I need to have distance sensor with these specification:

    • measurement range: 0-2 mm
    • bandwidth: 10kHz
    • resolution: 12 bits
    • repeatability: less 3 um over measurement range
    • minimum latency:  - now 100 usec for 10kHz bandwidth
    • sensing target: aluminum
    • coil diameter: less than 20 mm

    Is there a way to learn how LDC1101 measures frequency? I can then calculate limit repeatability and resolution.

    Thank you very much,

    Michael

  • Hi Michael,

    Keeping the sensor frequency low does provide higher resolution as per the graph. For very high resolution application we do recommend LDC1614 which has a 28 bit data output and can achieve higher resolution. However the principle of sensor frequency vs resolution still applies to LDC1614. 

    The internal operations of how the LDC1101 measures frequency is internal IP. What I can share is our LDCs drive the external coil to resonance and as the inductance changes due to change in target interaction the resonance frequency shifts. The change is frequency at resonance with no target and target is recorded and presented at the output pins. 

    We also have the LDC Calculator tool that can help you design using our LDC devices. Please take a look when you get a chance.