This thread has been locked.

If you have a related question, please click the "Ask a related question" button in the top right corner. The newly created question will be automatically linked to this question.

TDC1011: TOF Detection Problem

Part Number: TDC1011
Other Parts Discussed in Thread: TDC7200, TDC1000

We are using the TDC1011 AFE to interface to a 3MHz piezo sensor and the TOF we are getting is varying as much as 30uS when using a 3.5" container and as much as 60uS when using a 7.5" container.

All details of the test setup as well as TDC1011/TDC7200 register setting, scope screen shots, and output data are in the attached PDF.

If you  need additional information/clarification please let me know.

ThanksTOF Detection Problem.pdf

  • Hello,

    I have a few follow-up questions:

    Have you been able to verify with a series of manual measurements and the resulting scope plots of COMPIN and STOP, that the measurement variance is seen in the TDC1011 receiver path? Do you see similar end results using averaging with the TDC7200?

    You mention a TX voltage amplitude of 6.8V, is that the true voltage? The TDC1011 only supports up to 5V. 

    In the data you provided below for the 7.5" tank ToF, are these hexadecimal micro-seconds. If so the average ToF is about 70us off the expected time. 

    Regards,

    Gabriel

  • Hi Gabriel,

    Have you been able to verify with a series of manual measurements and the resulting scope plots of COMPIN and STOP, that the measurement variance is seen in the TDC1011 receiver path?

    Yes what we see on the receiver path by using the scope (screen shots were part of the PDF) are the the same variance seen by the TDC1011, when we see 120uS START to STOP on the scope that is also what the TDC7200 reports after we do the calculations fond in section 8.4.2.2.1 of the datasheet.

    Do you see similar end results using averaging with the TDC7200?

    Yes we see the same results when we do our own averaging or median search as well as using the "Multi-Cycle Averaging Mode" in the TDC7200 set to average 4-measurement and using the calculation in section 8.4.4. The following are readings from the Multi-Cycle Averaging Mode and the data is in uS.

     TOF       128
     TOF       141
     TOF       138
     TOF       129
     TOF       150

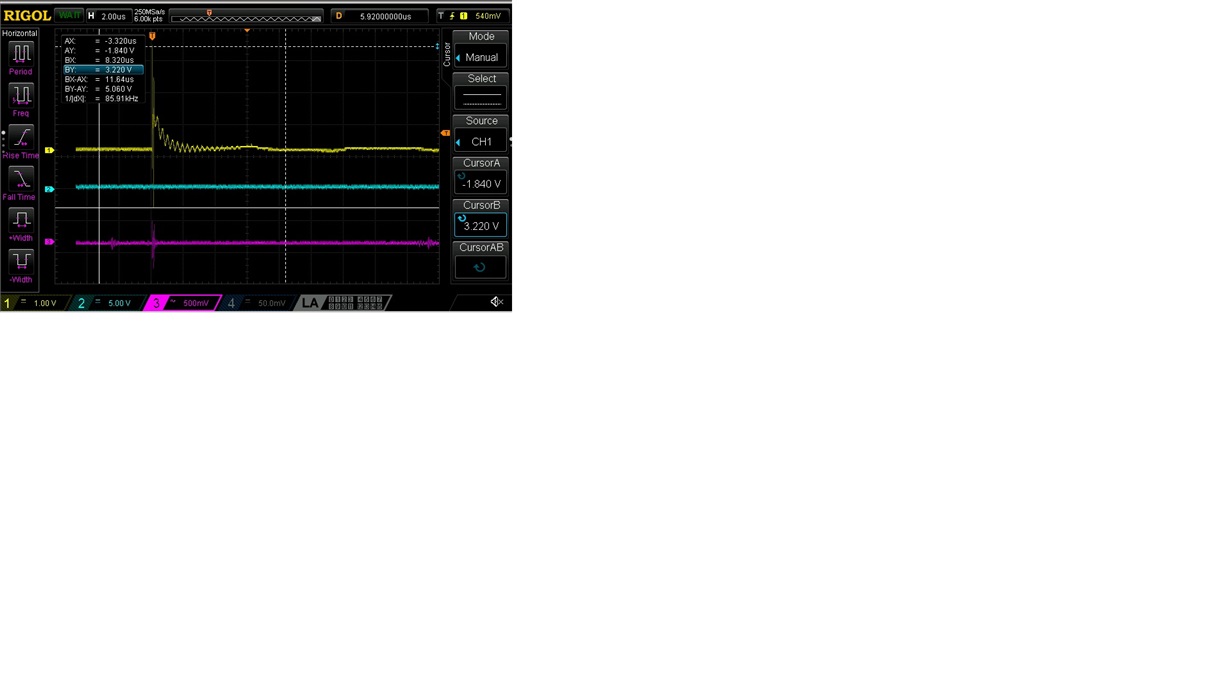
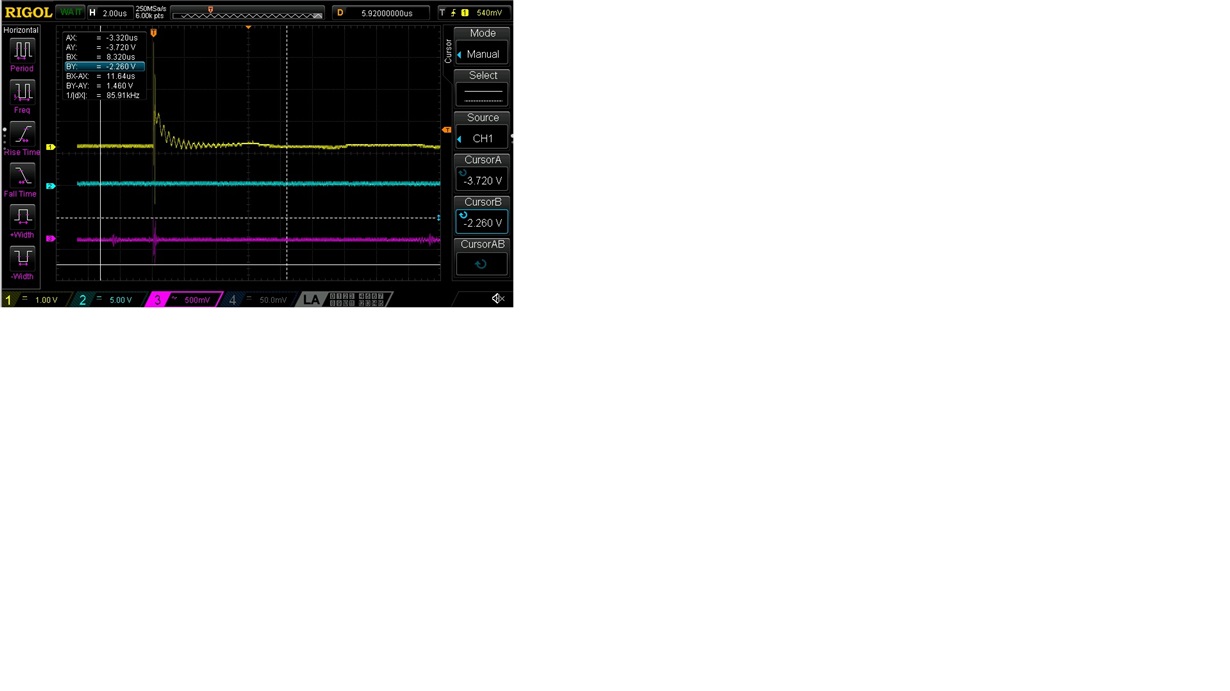
    We have an external boost circuit that we can control from 2.9vdc to 11.7vdc. We use this external boost to drive the VDD of a Gate Driver FAN3111ESX (https://www.mouser.com/ProductDetail/ON-Semiconductor-Fairchild/FAN3111ESX/?qs=%2Fha2pyFaduiXsCcsFp16g8yI80aBsDmy%2FISOVa7Teva5Cwl2rloKAw%3D%3D). With the RX having the 300pF cap we are AC coupled to the TDC1011. The amplitude of TX was measured at the FAN311ESX without a sensor connected, with a sensor connected the actual RX amplitude into COMP_IN after the gain stages is 1.4v p-p and the RX signal before the 300pF cap is 5.060v p-p, see JPEGs

    In the data you provided below for the 7.5" tank ToF, are these hexadecimal micro-seconds. If so the average ToF is about 70us off the expected time. 

    No the time is in actual uS, the "h" should not have been there, since these were sent I fixed that.

    As an additional experiment we removed the ceramic plate that was below the container of water so that the container sat directly on rubber foam and it did not make any significant difference in readings, I was hoping that the "Acoustic Impedance" difference in the materials would have a different TOF response but it did not.

    Thanks

  • One potential cause of this behavior is false positive spikes on the STOP line between TDC1000/TDC7200, but given the that the data with averaging is still pretty spread out, it may not be very likely. However, if you see any evidence of a false positives these can be dealt with by adding a series resistor on the STOP signal line near the TDC7200 to form a low pass filter with the input capacitance or you can try playing with autozero, blanking period, and LNA_CTRL. Also check your test  hardware and environment for noise that could be coupled to the transducer leads or your PCB. 

    If the received echo signal can be obviously identified in the scope plots, then I'd try altering the physical setup to see if any adjustments to transducer placement or mounting help identify a cause. I would continue to use multi-cycle averaging as well. 

    After this, if you are still seeing this issue, please send a scope shot zoomed in on the received echo on COMPIN and the STOP pulse, and also a few shots where you can identify the ToF variation on the scope plot, with time axis cursors (label expected ToF). Also include a picture or more details on the transducer mounting and the surface target (bottom of container/bag setup).

    Regards,

    Gabriel

  • Hi Gabriel,

    The attached PDF has the latest results that you were asking for and a couple of questions to make sure we are looking for the TOF in the correct time-frame.

    Expected TOF: 3” water TOF for water@7.62cm (3.0”)= (2*7.62cm) / 1480m/s = 102uS.

    If my calculations are correct, we should see it around 102uS, is this right?

    Or should we be looking at 204uS for the TOF being 102uS up to the water-air barrier and another 102uS back from the water-air barTOF Detection Problem Update 1.pdfrier?

    Thanks

  • Hi Duane,

    Yes you have it right. If the water is 3" deep and the transducer is mounted in the bottom as shown. 

    I have always seen accurate results following the How to Select and Mount Transducers in Ultrasonic Sensing for Level Sensing and Fluid ID  app note with one of the suggested transducers. To mount the transducer I recommend a high viscosity (gel type) super glue from the hardware store and then either clear silicone or hot glue on the back. 

    Have you taken measurements without using power blanking as well and do you see the same 88-149us variation with the transducer mounted to the side of the tank?

    My follow up and response to your other questions may be delayed until January 4th due to the winter holidays. 

    Regards,

    Gabriel

  • Duane, 

    I see the transducer leads are quite long, twisting them may improve the signal quality and SNR. With a 1MHz transducer I see a signal similar to this replicating the example from the app note. 

    I'm not sure why the received pulse would vary like that. 

    If you send your register configuration file or register hex values I can try to replicate the issue with my test tank. 

    Regards,

    Gabriel

  • Hi Gabriel,

    Looks like we have overcome most of the barriers by gluing the piezo(s) to the bottom of our acrylic containers we were able to get responses that made sense.

    Really appreciate all you time and help!

    Thanks