


Other Parts Discussed in Thread: IWR6843, IWR1443
Hi,
I'm using the IWR1443BOOST board ES3.0 version, with SDK 2.1. I try to play the Zone Occupancy lab from mmwave_industrial_toolbox_2_5_2 using IWR1443BOOST.
However, when I enable the log data, I found my doppler values are very weird. There are constantly extremely big values(>20000). Also, there are never negative values, which is wrong.
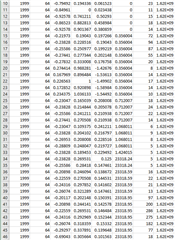 (sixth column is the doppler values)
The things I have done for debug:
1) I changed the matlab code a little bit to add the Abs Time Stamp in the final column. I undo that change, it's still the same.
2) I thought even I undo the change, the code might already be contaminated. So I download the brand new code from mmwave_industrial_toolbox_2_5_2 again and run it. Still the same.
3) I thought the board has some issues. I have another board and I try with it. Still no luck.
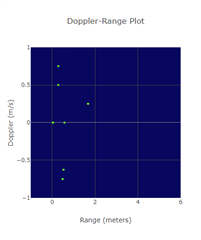
4) I tried to run mmwave demo visualizer website using the sensor, it works perfect, the dopper has both negative and positive values, as shown in the following:
What I suspect:
1) Maybe my .bin file was wrong? I use the 148KB xwr14xx_mmw_demo.bin from mmwave_sdk_02_01_00_04. I didn't flash two radarss file and the mss file as suggest in the zone_occupancy guide, because from a page I read that only ES2.0 support flashing two bin file while ES3.0 only need to flash the above one I mentioned. But I don't know if that cause a issue on my doppler reading. Should I try a new SDK and which version should I try?
2) Maybe mmwave_industrial_toolbox_2_5_2 is out of date? The newest one mmwave_industrial_toolbox_4_5_1 doesn't have the zone occupancy demo. Can you please inform me which latest toolbox verion have the lab zone occupancy demo?
Could you please help me solve this problem? It's really weird and bothering me.

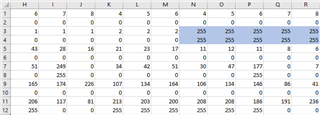 each column is a point data(12bytes) I want to know what each byte is standing for?