This thread has been locked.

If you have a related question, please click the "Ask a related question" button in the top right corner. The newly created question will be automatically linked to this question.

CODECOMPOSER: Loading Symbols (DWARF debug info) taking much longer all of a sudden

Part Number: CODECOMPOSER
Other Parts Discussed in Thread: MSP432E401Y, CCSTUDIO

I am using Code composer Studio 10.1.0 and developing using the MSP432E401Y and the 4.20.0.12 Simplelink SDK

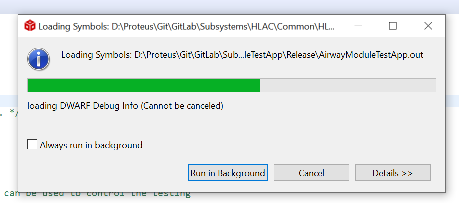
All of a sudden Loading Symbols is taking many times longer than it has before (at least 20 times longer).  I have been developing in this environment for years, and have never come accross this until now.  I have tried all of the obvious things to make the problem go away (restarting my system and target, rebuilding the project in a fresh workspace from scratch, using a different USB port for the XDS probe...).  I normally use an XDS110, but tried an XDS200 which I also have, and that had no effect either.

The program gets loaded to flash at the rate I am used to seeing, but when it comes to loading the symbols afterwards, the rate has dramatically slowed down.  It is intolerable.

My computer system is well maintained and running normally in all respects.

Any advice about how to resolve this would be very much appreciated.

  • Paul,  could you tell me what compiler you are using and it's version?  Would it be possible to share an example out file privately?  I understand if this is not possible.

  • Hello Andy. I much appreciate you getting back to me quickly. I would have followed up earlier, but I was under pressure to get a release out. It is really important for us to get to the bottom of this soon. The compiler we are using is TI v20.2.1.LTS. Unfortunately I can't share the out file. If we could do a Teams meeting, I could probably share my screen, and you could tell me what to look for. Alternatively, if I was able to provide you an out file, what is it that you would be looking for? Is there something that I could search for? What is actually happening when it is downloading the symbols? Since my last post, I even uninstalled CCS and reinstalled it, and that also did not resolve the issue.  This behavior is not particular to just one or two out files, but occurs with all of our projects.  I asked one of my co-workers to run the same project, and he was able to load the symbols at the normal speed - about 35 seconds. When I load the same project from my machine, it takes 4.5 minutes to load the symbols. So my system is loading about 7 times slower than it used to (last Friday morning, it was loading normally, and then later in the day it started to take 7 times longer - nothing special happened in between that I can recall) , not 20 as I mentioned at the beginning. It is still terribly slow, and feels like 20. Our out file takes up most of the availabe flash on the chip. Looking forward to hearing your thoughts about how to proceed.

    I also just posted another question about the XDS200 debugger. I don't know if it is somewhat related, but the issue has been nagging us for years, and because of the above, I thought I should try to resolve this other issue as well.  The other thread is at

    https://e2e.ti.com/support/microcontrollers/arm-based-microcontrollers-group/arm-based-microcontrollers/f/arm-based-microcontrollers-forum/1239692/msp432-debuggers-how-to-ensure-that-xds200-and-xds110-probes-are-properly-configured-and-optimized-for-peak-performance

  • Hi Paul. Thanks for the additional data. We were originally thinking this might have something to do with the way compressed symbols are handled by the debugger.  Your information does not support this theory. During the symbol load phase, the debugger is reading and decoding the DWARF information  included in the outfile. Internal data structures are constructed to enable quick lookup of symbol information during the debug session.  Essentially, there is a lot of disk read activity with data being pulled into memory.

    It is curious the issue affects only your PC and started happening without other apparent changes. Previous culprits for this type of thing have been interference by security software (AV scanners, privilege access managers, endpoint protection, etc), extra stuff in the system PATH variable, and Windows hook DLLs that have been inserted for various purposes (assuming you're working on Windows).

    If you can generate a debug server log and provide it to us, we can have a look to narrow down where the time is being used. The log will be huge but compresses well (especially with 7z). The log could be uploaded here or I can provide a shared drive location where you can upload it.

    Here are a few other things that could be tried to help narrow down the issue:  (1) Do you have the ability to temporarily disable the AV or end-point protection software you're using and retest the symbol load? This is actually the most likely issue. (2) Start "ccstudio.exe" from a command prompt, but simplify the PATH variable to include only items strictly needed and delete everything else. (3) Investigate what hook DLLs are being loaded - probably leave this one as a last resort.

    We'll have a look at the other thread.

  • Hi Andy.  I much appreciate all of the feedback.  I have uploaded the debug server log as you requested.  I have definitely considered the possibility of the AV scanner/endpoint protection being a significant factor.  A long time ago we had the ability to temporarily disable it.  I looked into it again just recently to see if there is some way I can disable it, and I couldn't find any.  Based on your feedback, I will now go to the trouble of opening a ticket with our IT support team (can be an arduous process which is why I typically avoid it, unless I have no other choice), and ask if they can disable any antivirus stuff while I load the out file via the debug probe, and see what that reveals.  The other reason I have not contacted IT about this is that I figured it should be affecting my coworker as well, but maybe the AV/endpoint protection configuration somehow changed for my machine last Friday, and not my co-workers.  

  • Paul, we had a look at the debugger log. There's nothing that specifically stands out as taking a long time. The time is being spent in the symbol loading phase (which you already knew) but distributed across the various actions. Loading code to the target took about 27 seconds. The remainder was for the symbols.  Please update us if you get anywhere with your support ticket. I feel your pain here.

  • Hi Andy.  I appreciate the feedback on the log.  From your previous post, it is good also to know that there is a lot of disk read activity which I think must be at the heart of the performance issue I am experiencing.  I have opened up a ticket with our IT support.  It has now been escalated to someone who has authority to disable such things as firewall/antivirus.  I'll let you know as soon as I know more.

  • Hi Paul, the team noticed something else in the log.  Without getting into details of what this does, would you be able to try the following to see if it helps your situation?

    • Exit CCS
    • From a command window, set environment variable  TI_DS_OFS_USE_ENTIRE_FILE=1
    • Start CCS from the command window (navigate to <install_dir>\ccs\eclipse, and run ccstudio.exe)
    • Try the slow load test case and look for any improvement.

    It is a bit of a long shot, but it may help reduce the number of reads and thereby improve load performance.

  • Hi Andy.  I tried the above steps involving setting TI_DS_OFS_USE_ENTIRE_FILE=1, and did  not notice any significant improvement.  I was contacted by our IT support asking for additional information, and I have directed them to this thread.  I hope that they will be able to help us.

  • Thanks for trying Andy's suggestion.

    Please keep us posted regarding the IT ticket.

    Thanks

    ki

  • I got to the bottom of it finally (at least bottom enough for my immediate purposes - as I need to get my work done, and not spend time resolving IT issues), and the problem was deep in the weeds.  I performed numerous tests involving the removal of various services via the Windows Task Manger from starting up.  After a bunch of trial and error, I isolated the issue to some enterprise printer driver management software named VPSX (https://www.lrsoutputmanagement.com/products/vpsx-enterprise/).  I presume that this was installed by our company.  I don't really do any printing, so I am not sure if I need these services at all.  In particular there was a task named VPSX Printer Driver Management Status Monitor which if disabled, allowed me to download the DWARF Debug info at the usual speed.  If I re-enable the service, the snail's pace downloading of DWARF debug info returns.  There were also two tasks named MFPSecure_Tray by the same publisher enabled and running, and also seemingly related to printer driver management.  I stopped those from running as well for good measure.  If I ever run into some printing related problem, I may need to re-enable some of this stuff, but at this point it doesn't seem that I will ever need it.  I will ask our IT support about the purpose of these services, and try to understand under what conditions I might need them.  I would be very interested in knowing what it is that is causing VPSX to interfere with the loading of DWARF info, but I don't have time to dig into that.  I examined the Task Manager on the PC of a coworker, and he has the same tasks enabled, and not experiencing any performance issues loading DWARF info.  I am guessing that it must have been some sort of update that VPSX performed on my system that triggered the issue.  I did find activity in the VSPX logs corresponding to the day the issue started occurring, but i have little idea as to the significance of the log content.  It could also be something in code responsible for downloading the DWARF debug info, that is not being done in the best way, making it vulnerable to some interaction with another service such as VPSX.

  • Thank you for the update Paul.  I'm glad to hear you isolated this frustrating problem and I'm sorry you had to waste so much time on it. These TI debug probes use the Microsoft USB driver (customized with different VID/PIDs). If this other product is interfering at a the USB level it will be challenging to track down.  Disappointed

  • Hi Andy.  Yes, so glad to have this behind us now.  That is a very helpful tip about the probes using the Microsoft USB driver.  It's not a stretch to imagine how a service dedicated to managing printer drivers would be actively doing something with the USB,

  • Unfortunately, the issue started to occur again on my system yesterday even thought the VPSX services mentioned earlier in this thread remained disabled.  So there is more to this issue than just the VPSX services.

  • Argh, sorry to hear the issue remains. These types of issues can be so difficult to fully resolve.

  • I was discussing this issue with AndyW and we are wondering if you see the same issue if *just* loading the symbols ('Run -> Load -> Load Symbols'). If you do, then we can rule out any USB conflict since loading just the symbols would not require any target communication.

  • Hello Ki.  I was on vacation last week which is why I did not respond until now.  I much appreciate you continuing to think about this. 

    My menu doesn't have Run->Load->Load Symbols, but I changed the debug configuration Loading Options to "Load Symbols only", and when running the configuration, the symbols still took a long time to load. 

    When using the configuration that I normally use, I can confirm that there is no change from past behavior in loading the program onto the target.

    Good to know that loading symbols does not require any target communication.  I remain stumped about this.  Our IT support team has responded, and indicated that they would like to do a session with me.  I will definitely follow up on that, and let you know how it goes.

  • My menu doesn't have Run->Load->Load Symbols

    This menu item would only be available in the CCS Debug perspective during an active debug session. 

    I changed the debug configuration Loading Options to "Load Symbols only", and when running the configuration, the symbols still took a long time to load. 

    If you are doing a project based debug launch then this would also suffice.

    Good to know that loading symbols does not require any target communication.

    You can even simplify your test case by doing a project-less (manual) debug launch and then loading just symbols after the debugger is launched but before you connect to the target:

    Our IT support team has responded, and indicated that they would like to do a session with me.  I will definitely follow up on that, and let you know how it goes.

    Please keep us posted.

    Thanks

    ki

  • Shortly after writing the above, I tried disabling / adjusting a number of other services on my machine that I thought had potential to interfere with the loading of symbols, but none of that seemed to have had any immediate effect, even after multiple reboots and many various experiments.  In my initial session with the IT support team, they temporarily disabled the Crowdstrike endpoint protection to see if by chance that would have an effect, but the issue persisted.  I was then escalated to the next level of support. I then had to tend to other tasks for a number of days, and when I was ready to demonstrate the issue, I could no longer get it to happen!  The loading of symbols has been performing at the normal speed for the last few days.  Hopefully the issue will not return.  I will post back if it does.

    You can even simplify your test case by doing a project-less (manual) debug launch and then loading just symbols after the debugger is launched but before you connect to the target:

    I appreciate this suggestion.  I have not tried this workflow yet, but I will, as I am curious to see how it works.