This thread has been locked.
If you have a related question, please click the "Ask a related question" button in the top right corner. The newly created question will be automatically linked to this question.
I have a CC1354P10 launchpad with an XDS110ET debug probe connected to it, a typical configuration. I'm running CCS 12.2 or 12.4 in Windows 10.
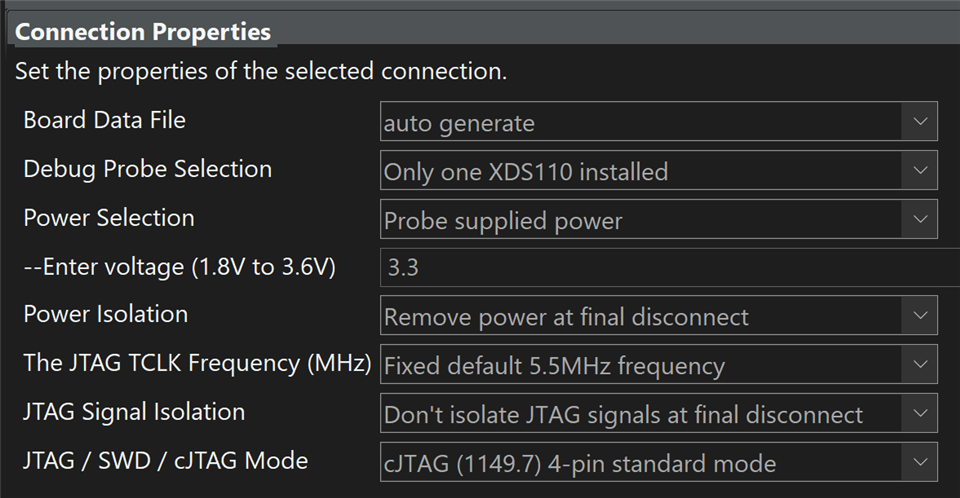
Connection Properties:
While trying to use EnergyTrace, or if I hit ContinuousRefresh in the Expressions view I very often encounter an unrecoverable crash:
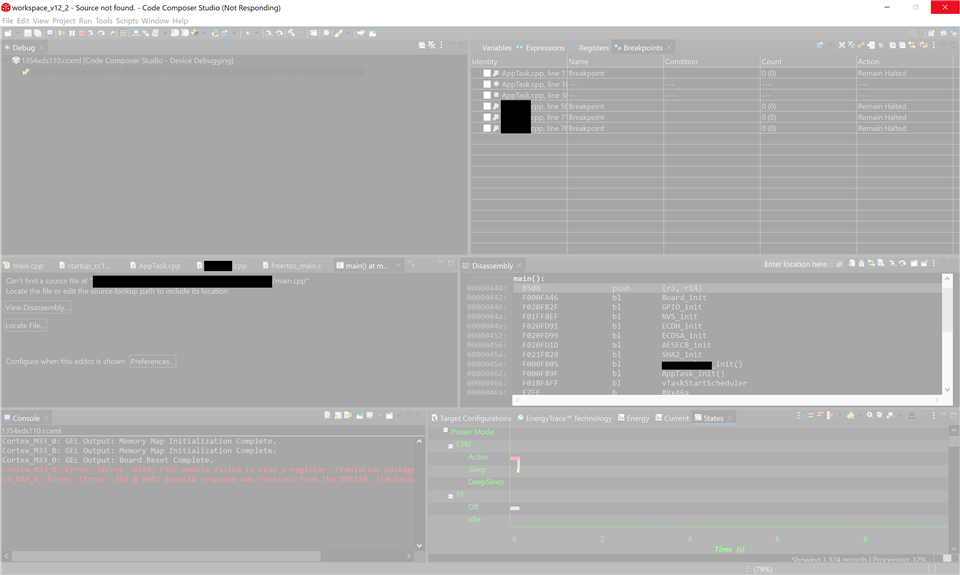
The crash happens most frequently when I'm using EnergyTrace, though it doesn't always happen. It happens often enough to be a problem, I'd say 6 out of 10 times.
I've tried to increase the JVM heap memory (even though this is a pretty beefy machine with 32GB of RAM) in C:\ti\ccs1240\ccs\eclipse\ccstudio.ini to no avail.
If CCS crashed, a crash dump file may have been generated. Can you attach them to this thread?
Also, if you can reproduce the issue fairly frequently, you can try enabling debug server logging and reproduce the issue while generating the log. Then disable logging, zip the log, and attach to this thread.
For more information in crash dump files and debug server logs, please see:
https://software-dl.ti.com/ccs/esd/documents/ccs_diagnostic-logs.html
Thank you for the files. I will have engineering take a look and keep you posted.
Engineering is still investigating. One inconsistency they noticed is that the dmp file says that ccs is installed in C:/ti/1240, and you mentioned that you are using CCS 12.2 and 12.4 but the dmp file also says the DebugServer is from CCS 12.5.
Did you incrementally update your 12.4 install to 12.5? If so, can you also try downloading and installing a full the direct CCS 12.5? Install to a different folder and use a new workspace folder for it. Then try again to reproduce.
Thanks
ki
I have found that the issue was related to opening a debug session and using serial over USB at the same time. Apparently there's some kind of race. I had to use the console by going to pins DIO12, DIO13, and GND, and leaving the USB connection for the debugging only
Thanks for the extra data. This is very helpful. Are you using the UART port on the XDS110?
I'm not sure what you mean. I am using serial-over-USB, when I switch to the GPIOs on the CC1354P10 for UART, EnergyTrace no longer crashes. It seems like using the USB for debugging and UART crashes EnergyTrace
Yes the serial over USB port via the User UART of the XDS110 (and not some other serial connection on the board/device.
It seems like using the USB for debugging and UART crashes EnergyTrace
I believe this might be a known issue. I will need to follow up with engineering
I can't seem to reproduce this issue. I am using CCS 12.5.0 with my LP-XDS110ET connected to my CC1354P10 LaunchPad. I have an example that uses serial-over-USB using the UART of the XDS110. I have some global variables in the Expressions view with continuous refresh on. I also enabled EnergyTrace and can get EnergyTrace data while everything is running fine.
I recall you had some issue with a CCS install that was incrementally updated to CCS 12.5.0 and doing a direct CCS 12.5.0 resolved that issue. Are you still seeing this EnergyTrace issue with the direct 12.5.0 install?
Yes, it's still occurring. Well, my colleagues also can't seem to be able to reproduce this, but it's consistent on my machine
While trying to use EnergyTrace, or if I hit ContinuousRefresh in the Expressions view I very often encounter an unrecoverable crash:
Can you clarify this comment? Do you mean either one as in even if EnergyTrace is not opened at all, if you hit continuous refresh you also get the hang/crash?
Yes, that's correct, though I've found that one to not be as reproducible. I don't know what factors into that happening
Well, my colleagues also can't seem to be able to reproduce this, but it's consistent on my machine
Did you colleague try with your launchpad and program? Same USB cable? Is their machine similar to yours? USB cable plugged directly to the laptop?
No, they tried with their own launchpad, debug probe, USB cable, and machine. Both of our machines are Dells, same model, with Windows 10 though. USB cable plugged directly through the computer and through a hub too (I also tried this and didn't make a difference)
Also, while not using the UART at the same time as a debug session has massively improved the problem, it still hasn't fixed it. I still crashes
No, they tried with their own launchpad, debug probe, USB cable, and machine.
Can they try with your launchpad, debug probe, and USB cable on their machine?