This thread has been locked.
If you have a related question, please click the "Ask a related question" button in the top right corner. The newly created question will be automatically linked to this question.
Hi,
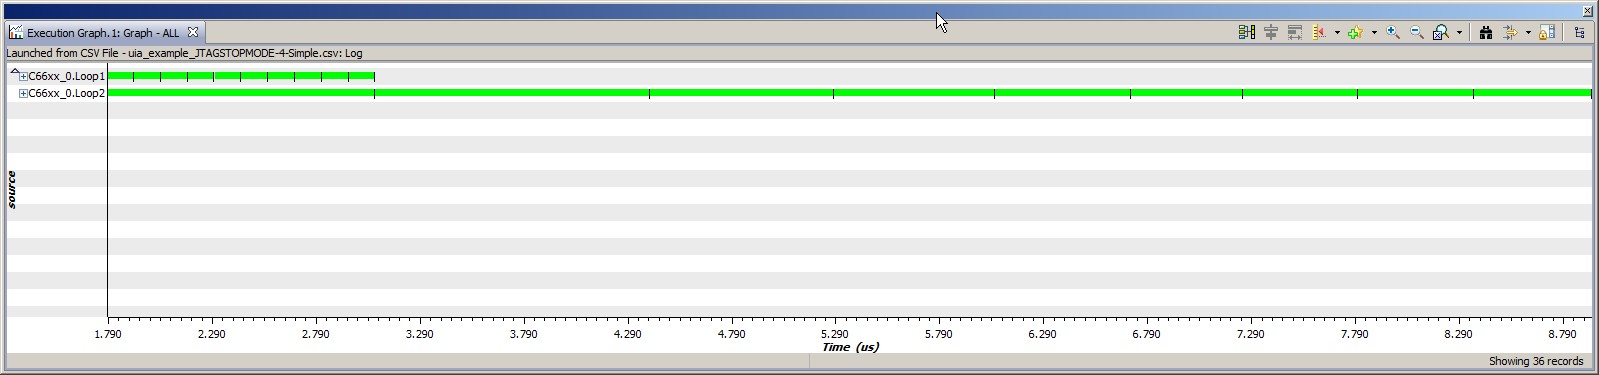
I just discovered an issue with the execution graph display of code composer 5.3.
A trace data file, which is displayed correctly in code composers 5.2, will generate an empty execution graph in ccs 5.3
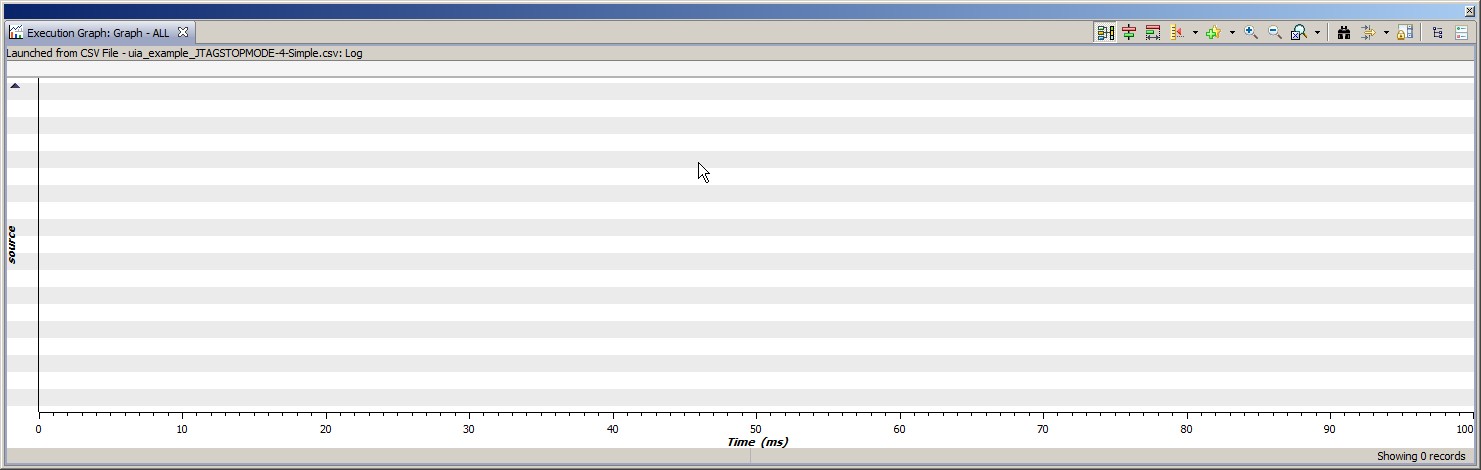
ccs 5.2 execution graph is OK
This is the .csv data file I used for reproduction of the issue.
Read in the data file and run execution graph (tools->system analyzer->open csv, analyze->execution graph)
0743.uia_example_JTAGSTOPMODE-4-Simple.zip
I use ccs version 5.3.0.00090, on Windows 7, 64-bit
thanks and best regards
Alois
Hi Alois,
your .cvs file seems to work correctly for me.
I'm using Version 5.3.0.00083 on Windows 7, 64 Bit.
Ralf
Ralf Goebel said:Hi Alois,
your .cvs file seems to work correctly for me.
I'm using Version 5.3.0.00083 on Windows 7, 64 Bit.Ralf
Probably its specific to my platform, java version or java heap memory size ?
I have installed 8GB of physical memory
Alois
Alois,
I see the same problem here in my CCSv5.3.0.00090. Despite the raw data is shown, the execution graph does not display the information as in release 5.2.1.
I will check some additional details and possibly file a bug on Monday.
Sorry for the inconvenience,
Rafael
hi Alois
am a beginner in using DSP/BIOS. am using CCS3.3 version for tms320c6701 . How do we get this execution graph?
This discussion was for CCS 5.1 or later. CCS3.3 is different and I can't help, sorry.
Alois
RANJANA AJAYAKUMAR said:am a beginner in using DSP/BIOS. am using CCS3.3 version for tms320c6701 . How do we get this execution graph?
See the DSP/BIOS User's Guide (spru423f.pdf). It comes with your CCSv3.3 installation under:
<CCSv3.3 INSTALL DIR>\<BIOS DIRECTORY>\packages\ti\bios\doc
See section 3.4.1 for the Execution Graph.