Because of the holidays, TI E2E™ design support forum responses will be delayed from Dec. 25 through Jan. 2. Thank you for your patience.

This thread has been locked.

If you have a related question, please click the "Ask a related question" button in the top right corner. The newly created question will be automatically linked to this question.

Graph tool: plotted lines become transparent when using grids

Hi all,

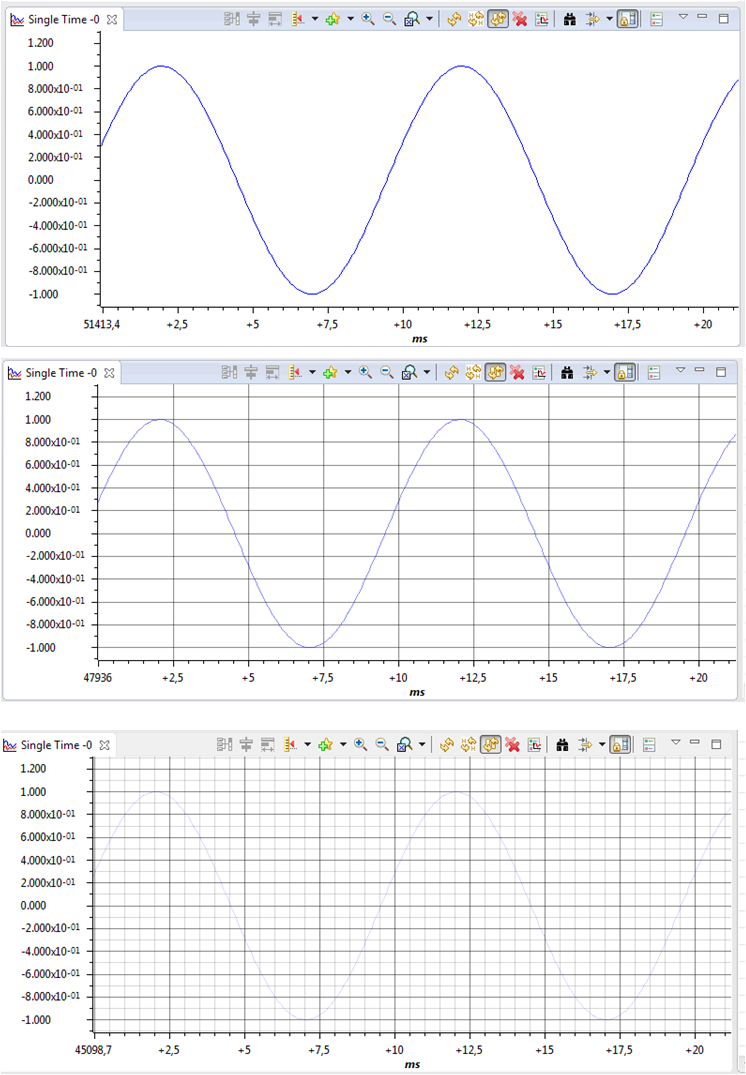
For last versions of CCS (actually using 6.1.0), this problem appears continuously. When plotting anything on the graph tool (single or double time) and using a background grid, the plotted curve becomes thinner and less visible. Using "Minor grid" is even more critical because the plotted curve even "desappears". Example images are attached.

As there's no way to plot two curves on the same graph to compare them, grids are really helpfull.

Is there any way to solve this?

Thanks,

Alex

  • Alex Segura,
    ---------------------------As there's no way to plot two curves on the same graph to compare them------------------------------------
    there is no such type facility available on CCS v6 or v5.    go through this link https://e2e.ti.com/support/development_tools/code_composer_studio/f/81/t/320281


    Can you tall me how to write sin generation code & its single time graph properties setting.

  • Hi Asim,

    Thanks for answering.

    This quality loss of the plotting occurs regarless of the variable/function/curve plotted. Anyway, the curve used for the example on the image is a direct call to the floating-point function "sin()". Graph properties are as follow:
    - Data Props:
    --- Acq buffer size: 256
    --- Data type: 32 bit floating point
    --- Index increment: 1
    --- Q_Value: 0
    --- Sampling Rate: 12000
    --- Start Address: &dlog1.log
    - Display Props:
    --- Axis display: true
    --- Data plot style: Line
    --- Display data size: 256
    --- Grid Style: none, major grid or minor grid
    --- Mag display scale: Linear
    --- Time display unit: ms
    --- Use DC value: false

    I must point that these differences between grids are not such when graph window is maximized.

    Regards,

    Alex

  • Alex Segura said:
    When plotting anything on the graph tool (single or double time) and using a background grid, the plotted curve becomes thinner and less visible.

    I couldn't find a way to solve this but I will file an enhancement request to see if anything can be done to maintain the visibility of the plotted curve even when grids are used.

  • Filed as request # SDSCM00052254.