Tool/software: Code Composer Studio
Hello,
I am wondering if there is any way to overcome the following limitation in Debug View:
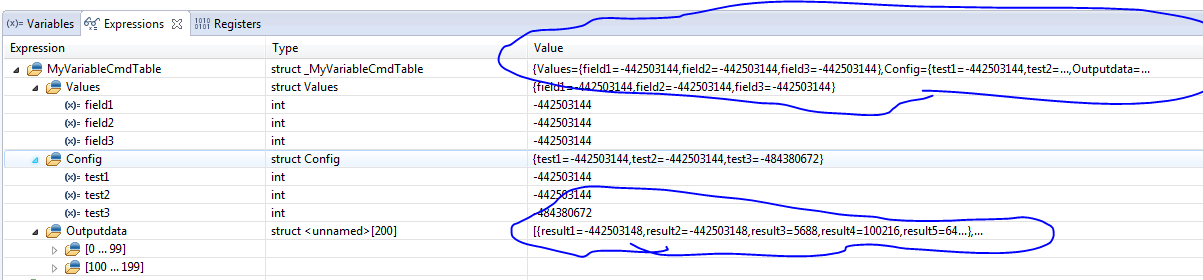
- Expression window supports a short preview of data structures as reflected on the screenshot below
- The output is limited to some amount of characters after which the only way to see the rest is to expand the tree, which is quite painful when data structures are HUGE and doesn't let us search data
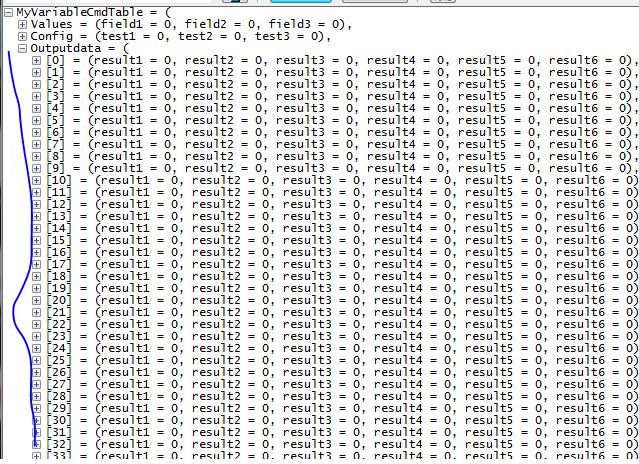
- I would like to see the WHOLE structure with all 200 array elements with no limits and FULL representation of internal data fields
If I am correct, this limited feature has been introduced around CCS v6.1. However, it doesn't fully satisfy all needs.
Popular (and unfortunately expensive) debugger studios like Lauterbauch Trace32 do represent table data in a MUCH and MUCH better way. Every entry in OutputData expands as a table, and structure fields are represented as a single line. Trace32 software is extremely old, but yet gives this convenience in representing table data in the best way possible. So why limit the output?
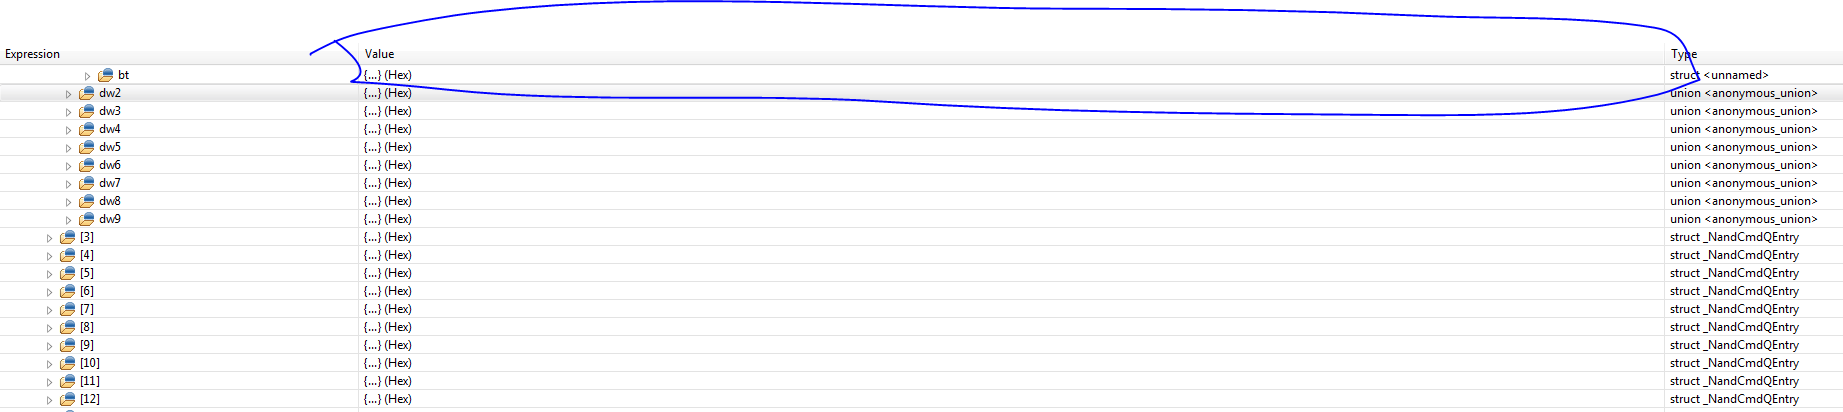
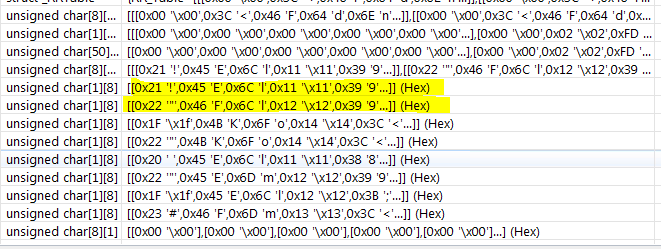
Trace32 Example: endless string with Outputdata array with no limits

Trace32 Example: expanding array of structures
This also improves a search capability when I need to find fields with specific values. How do I do that with CCS?
Most likely, it is a change request for Code Composer Studio. But I would still be happy to know if there is a way to develop a plugin for CCS and extend this functionality myself. Perhaps, that would require source code though :(
Thanks