This thread has been locked.

If you have a related question, please click the "Ask a related question" button in the top right corner. The newly created question will be automatically linked to this question.

CCS: Not able to see the source code window loaded in Debugger after successful target configuration launch for Multi-Core SoC

Tool/software: Code Composer Studio

Hi all,

I built a simple hello world  with LED blinking program in project explorer of CCS for the selected target(Cortex M4) for a multi-core SoC (DRA72x). For debugging this code ,manually opened the target configuration file from target  configuration window of CCS ,which opened the debugger correctly. Then i connected Master A15 Core,followed by IPU1 (Cortex_M4) core in the debugger.The debugger console print shows both cores are correctly connected.

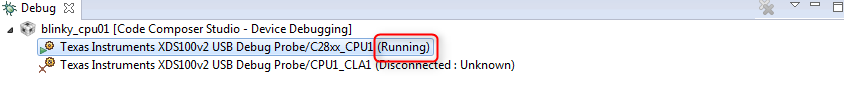
Then loaded the .out file manually and then clicked the run option from the menu. IPU1_Cortex_M4 target showing running green icon.But source code window is not opened into the debugger and it is not breaking at main().

1.I like to know whether the code is actually executing.

2.My question here is how to see the source code in the debugger so that i can step through the c source file in debug view.

3.I assume -g option is enabled by default in target compiler selected, to include debug symbols in .out file.Please let me know otherwise and where to add this option.

With regards,

Jeyaseelan

  • Hello Jeyaseelan,

    jeyaseelan kirubaharan said:
    1.I like to know whether the code is actually executing.

    You can see the CPU state in the debug view:

    jeyaseelan kirubaharan said:
    2.My question here is how to see the source code in the debugger so that i can step through the c source file in debug view.

    See slides 53-58 of: software-dl.ti.com/ccs/esd/training/CCSv6-TipsAndTricks.pptx

    jeyaseelan kirubaharan said:
    3.I assume -g option is enabled by default in target compiler selected, to include debug symbols in .out file.Please let me know otherwise and where to add this option.

    This is not always the case. Check the project properties:

    Thanks

    ki

  • Thanks Ki for your detailed and clear explanation.I will check and confirm you shortly ,how the behavior is.

    With regards,
    Jeyaseelan
  • It works.
    1. Built the project with -g enabled
    2. Launched the target configuration file from user defined of target configuration window
    3. Connected the Master-A15 core and then run Intialize Multicore .gel scripts from scripts tab
    4.Then connected the IPU1 core(the core ,from where wanted to run the source)
    5.Then Loaded the .out file generated which was generated already from project explorer window by clicking the load icon in the task bar of debugger.
    6.Then clicked Run green icon for the code to run in the selected target.(Now the code shows running,but not seen the source yet)
    7.Now selected Run-> Debug Configuration
    8.In that window, selected the target configuration file.It opened a new window with many tabs
    9.Selected the source tab and added the folder path of the project explorer of my project in the sub-window listed.
    10.It asked to relaunch the Debugger .
    11.On relaunching,it reloaded the source file on which i could able to do the single step.

    After this on every launch the source file is automatically loaded

    Thanks once again Ki for your timely support.

    With regards,
    Jeyaseelan