This thread has been locked.

If you have a related question, please click the "Ask a related question" button in the top right corner. The newly created question will be automatically linked to this question.

CCS/CCSTUDIO: CCS8.1.0 — EnergyTrace Current and Energy Graphs Consistency

Part Number: CCSTUDIO
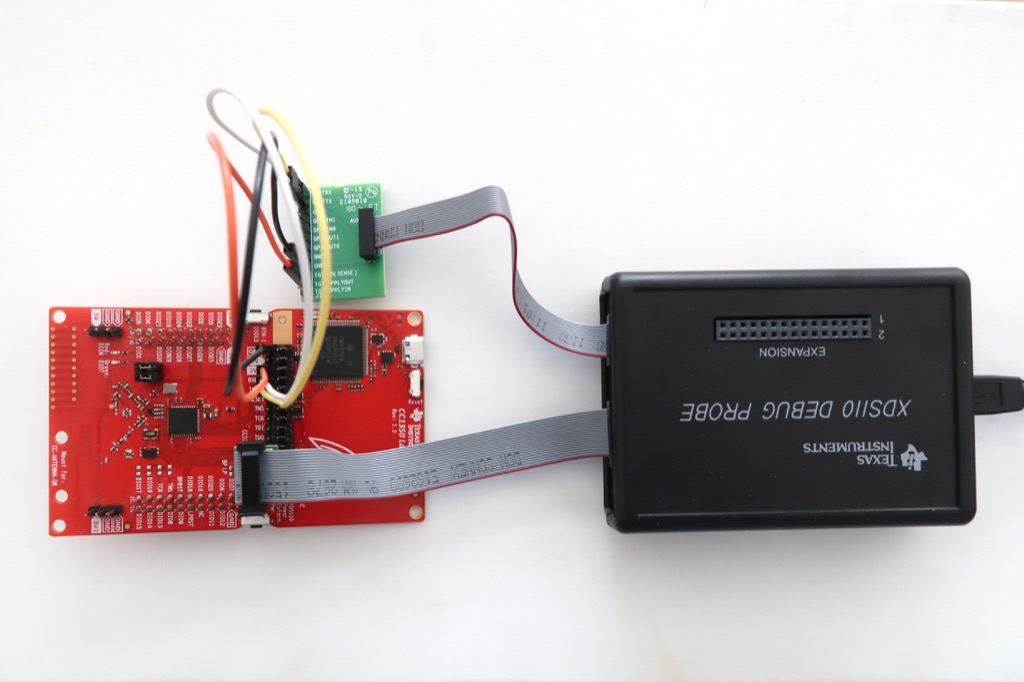
Other Parts Discussed in Thread: CC1350, LAUNCHXL-CC1310, ENERGYTRACE, TMDSEMU110-ETH, CC2640R2F, CC1310, MSP-EXP430G2ET, MSP430G2553, MSPDS, TMDSEMU110-U

Tool/software: Code Composer Studio

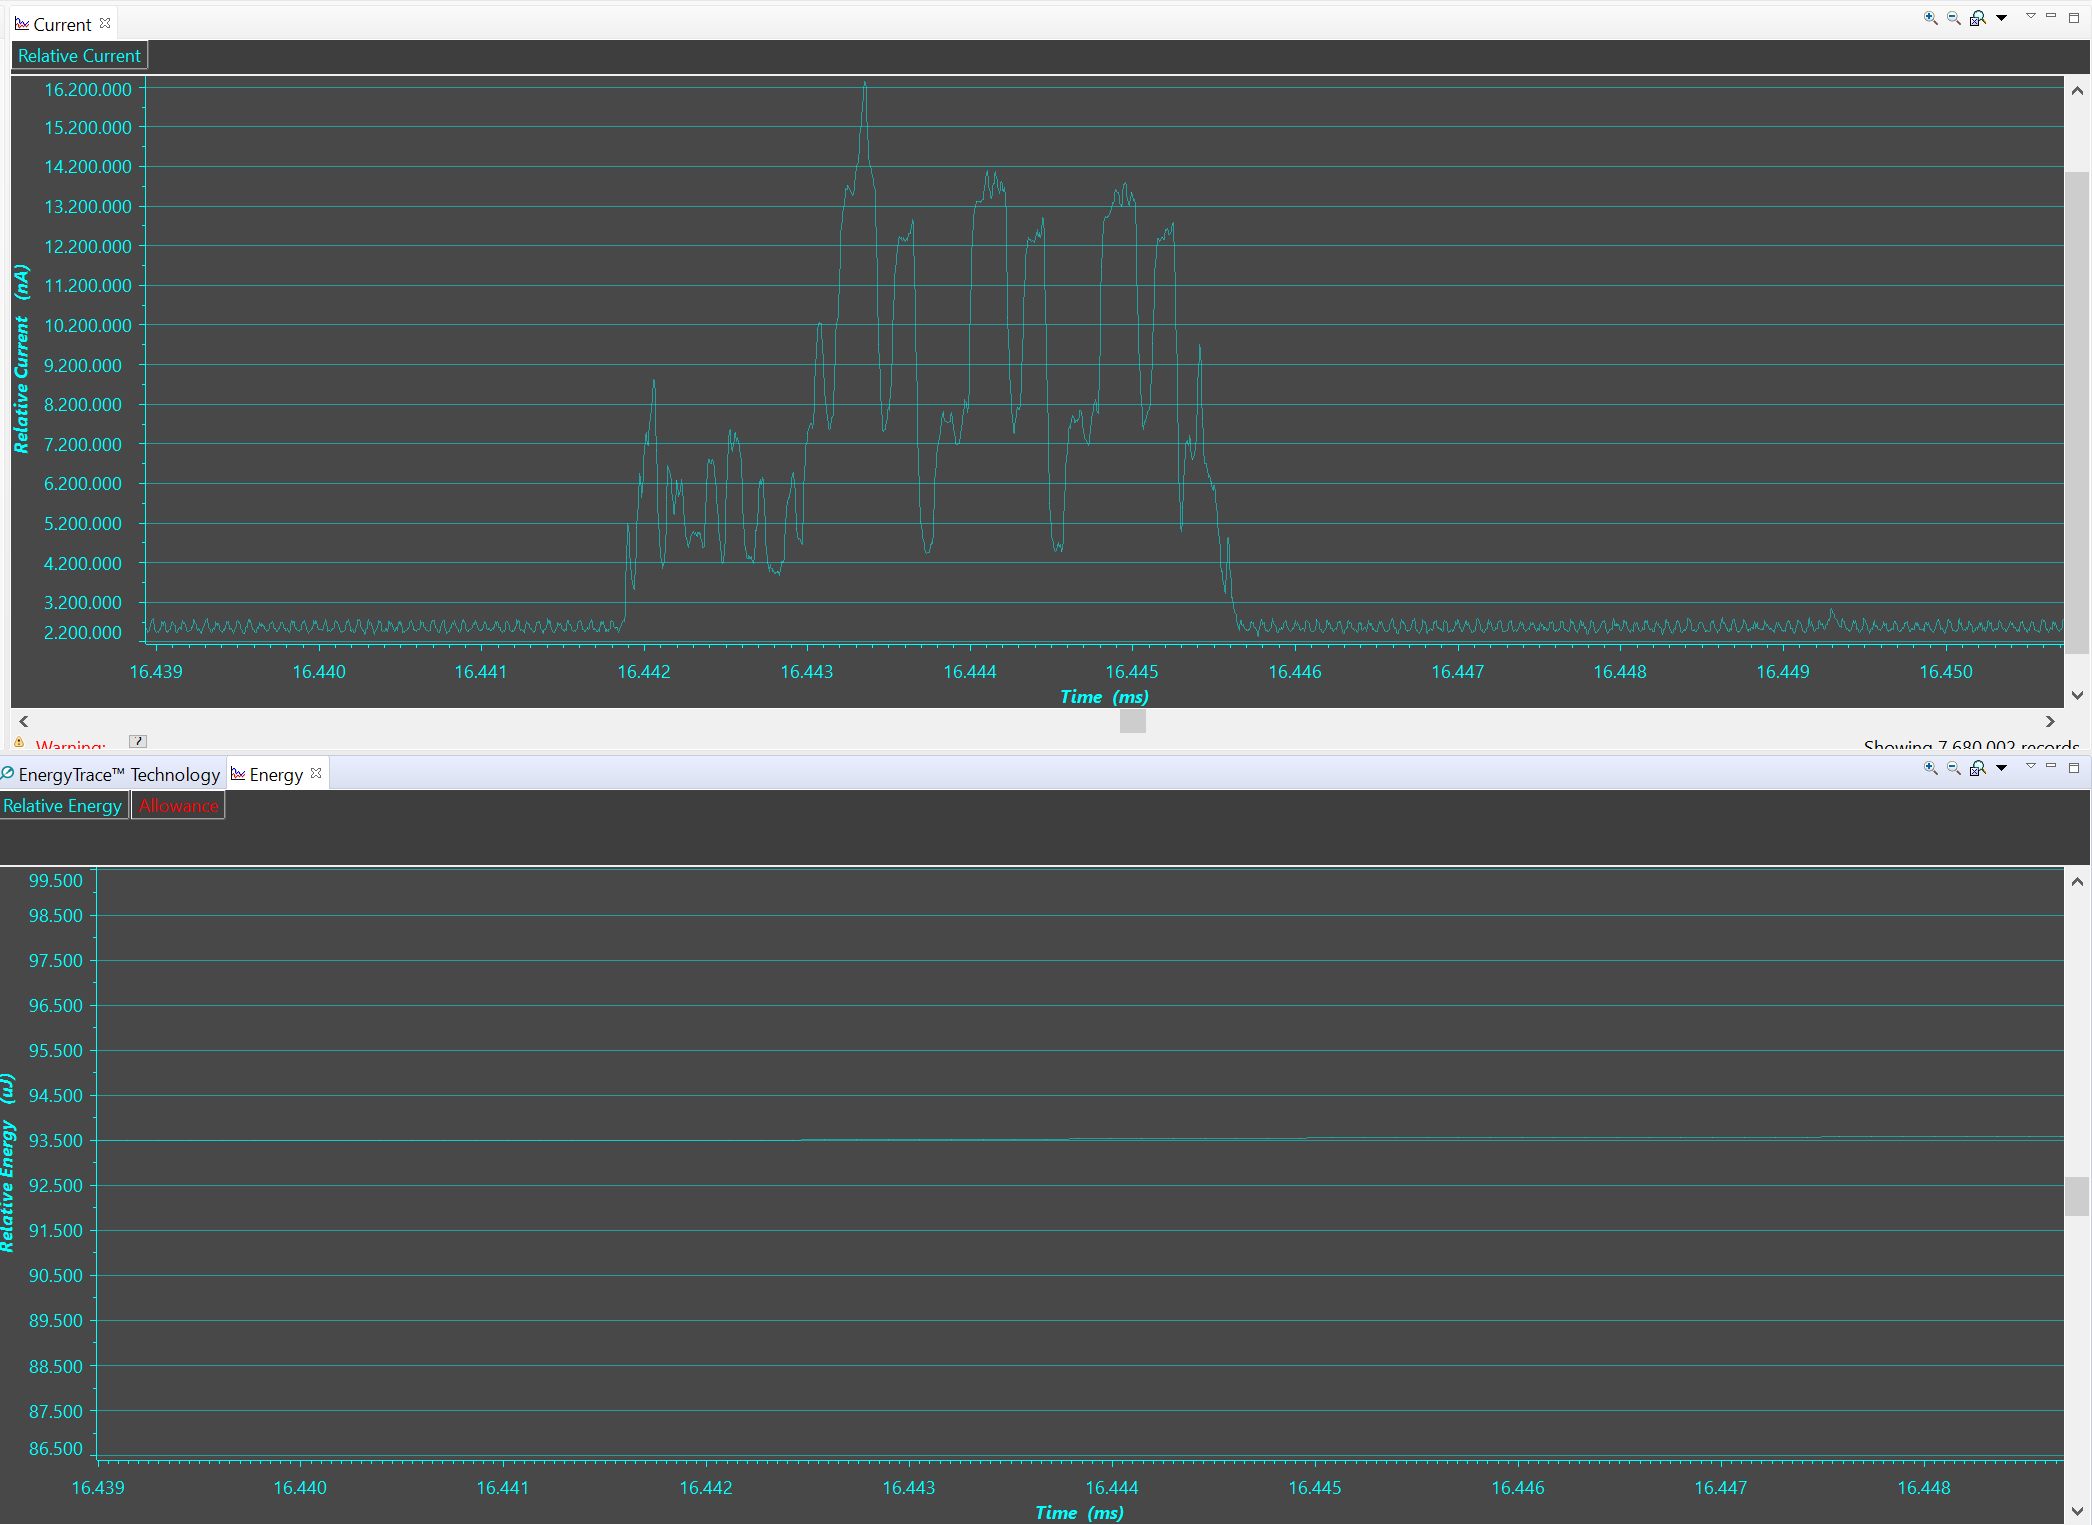
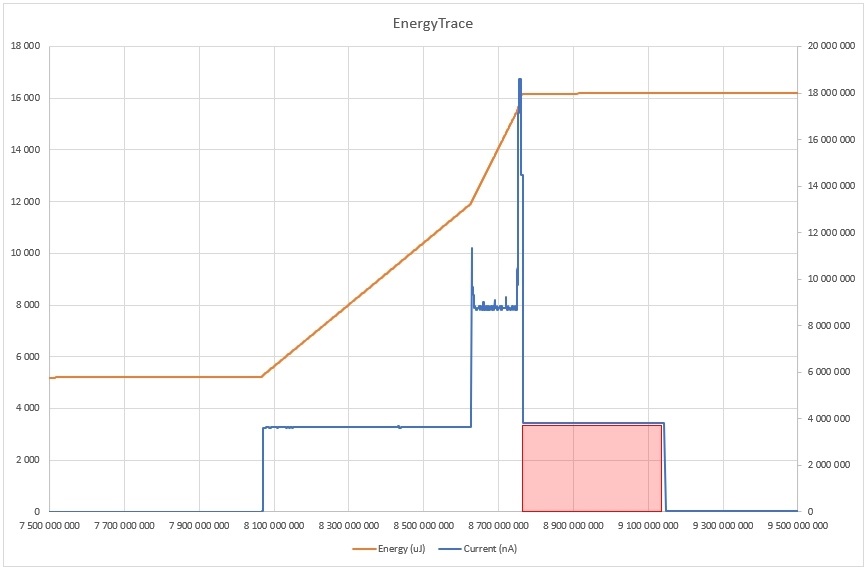
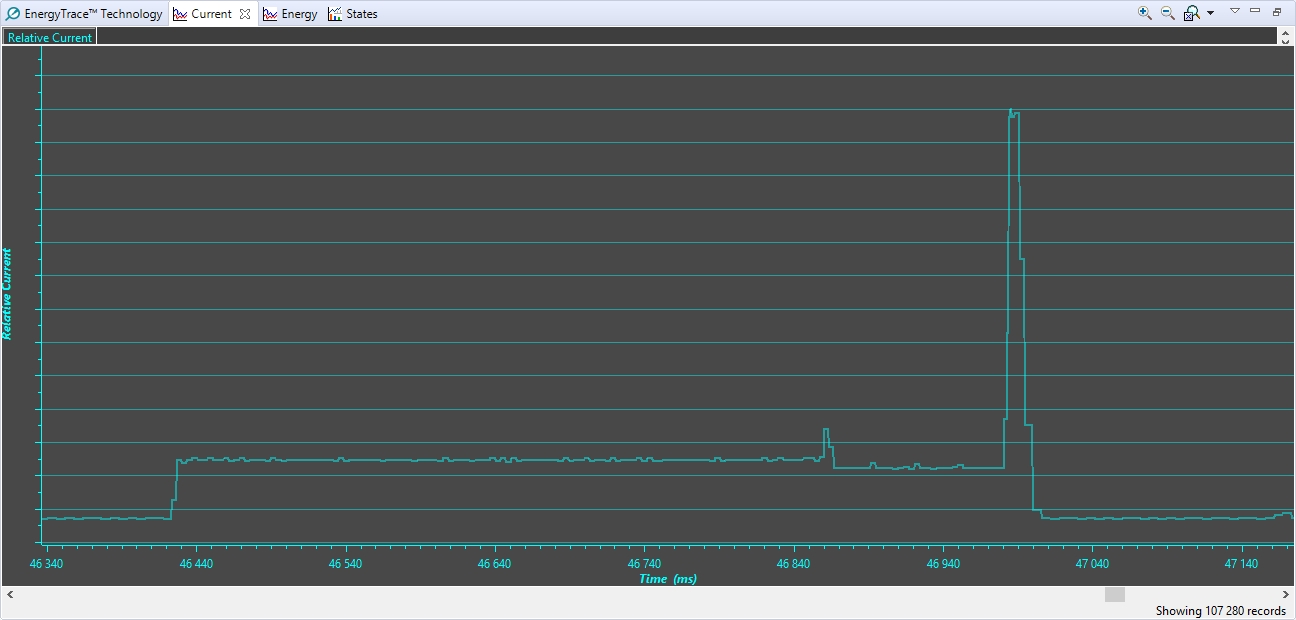
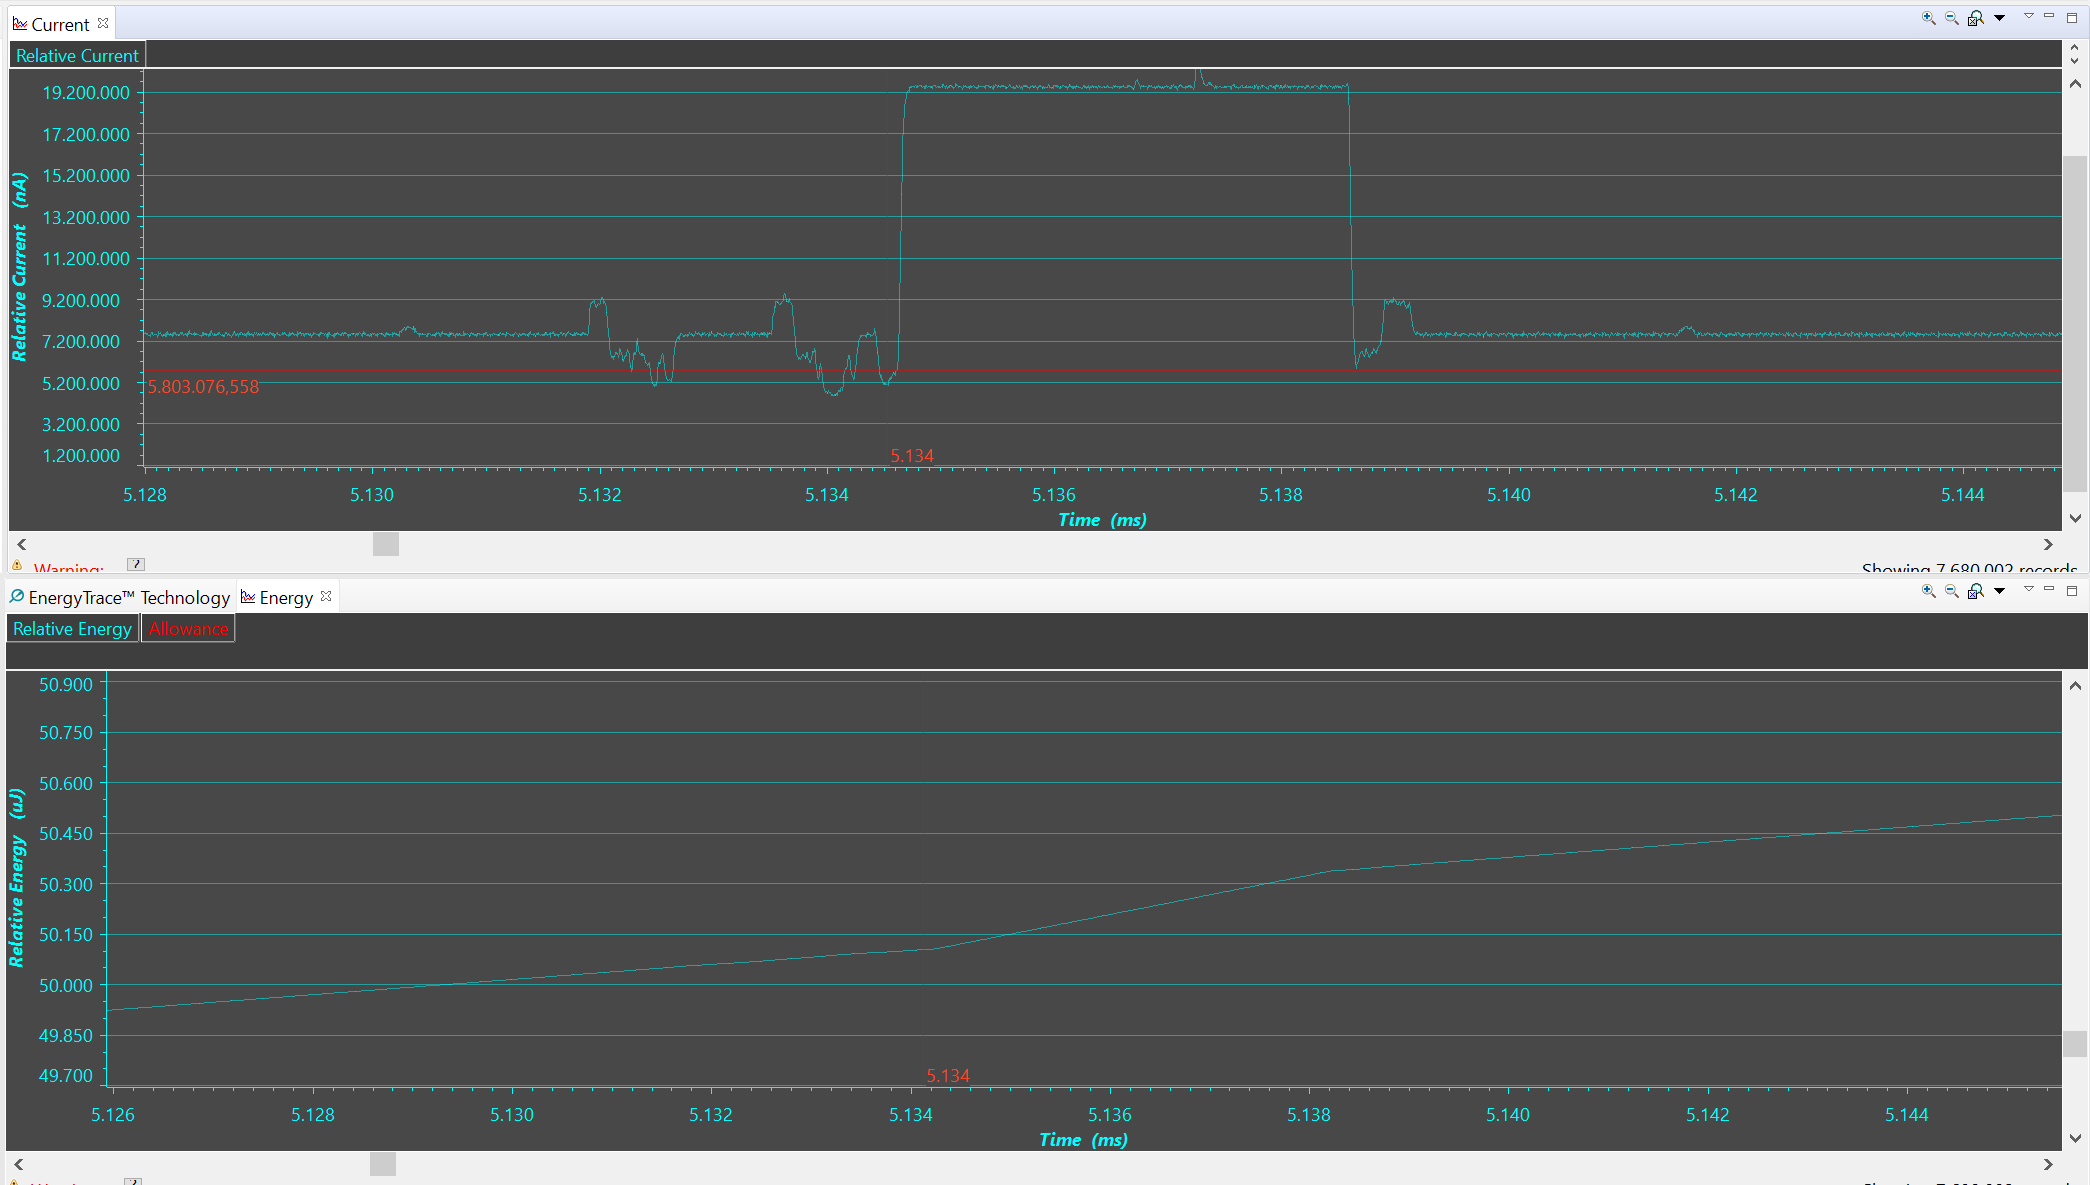
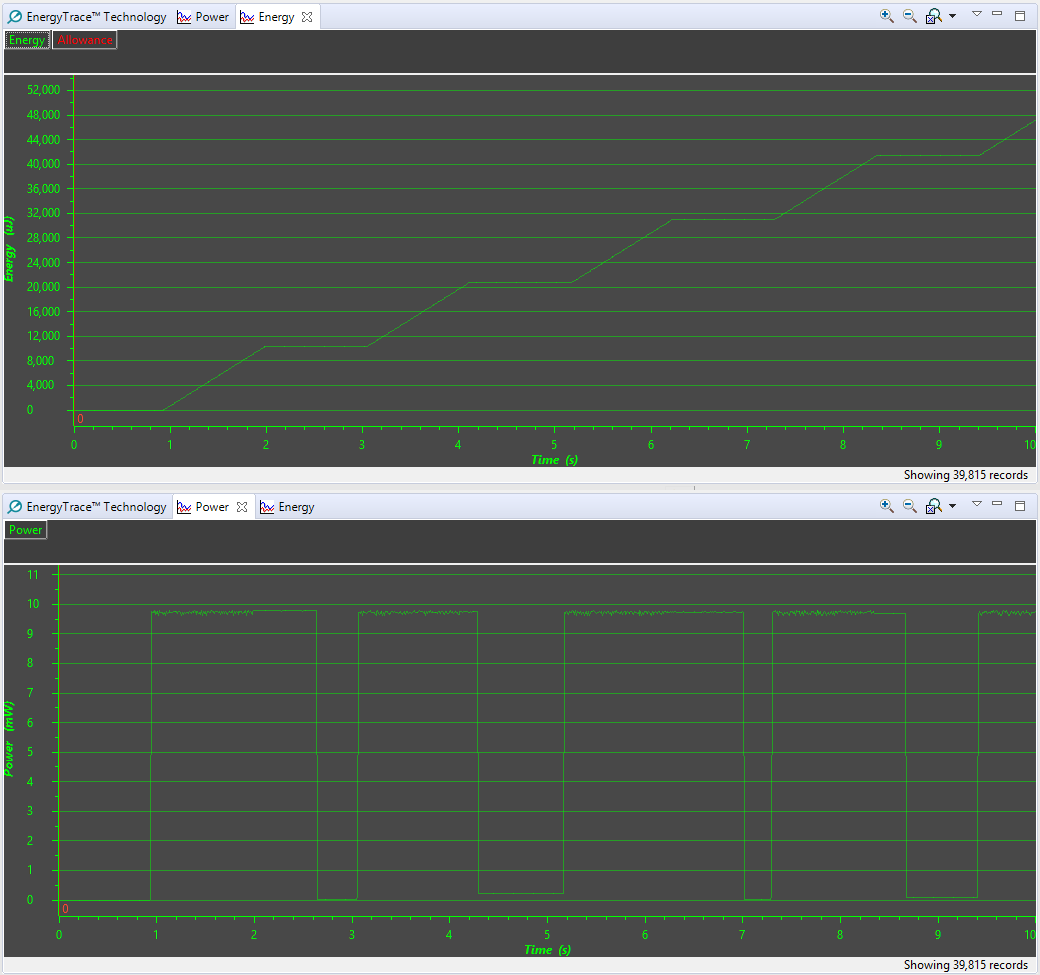
With CCS 8.1.0, I still experiencing the issue reported at CCS6.1.0: EnergyTrace Reference profiles are plotted incorrectly.

On post Thu, Sep 10 2015 8:34 PM,  filed the bug for future release.

Has the bug been fixed and released with a patch, or is it inherent to the EnergyTrace technology?

Thank you!

  • Configuration includes:

    • Hardware:
      • Computer: Windows 10
      • Board: LaunchPad CC1350 (LAUNCHXL-CC1310) + Sensors BoosterPack (BOOSTXL-SENSORS)

    • Software:
      • CCS 8.1.0
      • TI-RTOS

  • Hi,

    Can you share the code (or at least the example) that you used to trigger this?

    Thank you,
    Rafael
  • The code of the whole project? I'm afraid that wouldn't be possible.

    Basically, a clock triggers a task every ten minutes. The task acquires data from sensors and send values to a base through sub-1 GHz using the EasyLink library.

    Apart from the 694 ms of activity, the LaunchPad CC1350 (LAUNCHXL-CC1310) + Sensors BoosterPack (BOOSTXL-SENSORS) remains in deep sleep mode as reported by EnergyTrace++.
  • Hi,

    The reason why I asked for the code is because it was unclear to me the current consumption of the time slot of 343ms was above 3mA or zero and, if you were using an example code, that would be a quick way to try to reproduce it.

    However, in an ad-hoc testing I was doing with a CC2640R2F and the TMDSEMU110-ETH I accidentally found a scenario quite similar to yours: check the screenshots below.

    Comparing this with the same region plotted in Excel (you can save the ET data to a .csv file) proves the bug is still outstanding (or was reintroduced at a later time).

    I will check with the developer and probably file a bur report.

    I apologize for the inconvenience,

    Rafael

  • I performed a new trace, took the data from the .csv file and plotted it with Excel.

    It looks like the same issue is affecting the data exported to the .csv file.

  • Olivier,

    The issues are different then. Yours seem originated on the pod, while mine is originated on the display (which also matches the bug of the previous thread).

    By the way, the graphs showed by you indicate you are running EnergyTrace. EnergyTrace++ is only supported by selected MSP430FR devices (I know, it is a bit confusing).

    I will try to run this same test on the board you have - by the way, which one is it? Is it the CC1310 or CC1350?

    Regards,
    Rafael

  • Rafael:

    All measures were conducted on 2 different CC1350 LaunchPads (LAUNCHXL-CC1310) + Sensors BoosterPack (BOOSTXL-SENSORS), both with an identical configuration.

    Sure, the graphs posted before on this thread rely on EnergyTrace.

    But I checked with EnergyTrace++ the state of the MCU and compared the EnergyTrace++ relative power graph (correct) with the EnergyTrace power graph (not correct).

    As the CC1350 LaunchPads doesn't feature EnergyTrace++, I'm using the external XDS110 JTAG Debug Probe (TMDSEMU110-U).

    If other tests and checks are required, please let me know.

  • Olivier,

    Unfortunately I was not able to reproduce the problem in my CC1350: the graph looks ok to me when I monitor the power consumption at several locations in my trace. I am running the sensor_cc1350lp and below there is some example data:

    Also, the developer pointed out the issue on my prior data capture: the image was not zoomed enough vertically to properly identify the Energy trend increase. I re-ran the previous case on my CC2640R2F and was able to display something more consistent.

    I will see if I can find a scenario where the Energy graph is "broken", but at this point I am unsure what may be happening in your setup. 

    Regards,

    Rafael

  • I reported the same bug in this thread: https://e2e.ti.com/support/development_tools/code_composer_studio/f/81/p/448872/1622952#1622952

    The problem only arises when the power consumption drops from a high to a very low level. In my test case the low power state is approximately 3uW.

    Here's a small example program to reproduce the issue, it's for the MSP430G2 launchpad:

    #include <msp430.h> 
    
    void main()
    {
        /* stop watchdog timer */
        WDTCTL = WDTPW | WDTHOLD;
    
        /* Switch ACLK to VLO */
        BCSCTL3 = LFXT1S_2;
    
        /* Set all GPIO to input with pulldown resistor (except P1.3, which is HiZ due to the external pullup) */
        P1OUT = 0x00;
        P1REN = ~BIT3;
    
        P2SEL = 0x00;
        P2OUT = 0x00;
        P2REN = 0xFF;
    
        P3OUT = 0x00;
        P3REN = 0xFF;
    
        /* Switch one LED on (P1.0) and set the other LED (P1.6) to TimerA output */
        P1REN &= ~(BIT0 | BIT6);
        P1DIR |= (BIT0 | BIT6);
        P1OUT |= BIT0;
        P1SEL |= BIT6;
    
        /* Set TimerB to toggle TB3.1 at ~0.5Hz */
        TA0CCR0 = 11000;
        TA0CCTL1 = OUTMOD_4;
        TA0CCR1 = 5500;
        TA0CTL = TASSEL_1 | MC_1 | TACLR;
    
        /* Enter LPM3 */
        __bis_SR_register(LPM3_bits);
    }

    All it does is blink one LED at 0.5Hz and switches the other on. The chip is configured for low power consumption by terminating all the other inputs appropriately.

    For the clearest reproduction of the issue, remove the TXD, RXD, SBWTCK and SBWTDIO jumpers from the G2 launchpad after programming. Then run a standalone EnergyTrace session (no JTAG debug connection). You can do this directly with the MSP-EXP430G2ET, or use another EnergyTrace launchpad to power the MSP430G2553 target. If you use a second launchpad you need to disconnect the targets on both boards from their emulators to avoid excess power consumption that will break the test.

    First capture an EnergyTrace with neither LED jumper in place. That will show the power consumption of just the MCU. I get around 30uJ for a 10s capture.

    Next capture with both LED jumpers in place. The power and energy graphs will match up as you would expect. The power graph will toggle at around 0.5Hz with 50% duty cycle.

    Finally, remove the jumper for the always-on LED and capture again. Now the power graph should be incorrect, showing high power where it should have dropped to the lower level. Here's an example of a bad trace. You can see that the steps in the power graph aren't aligned with corresponding changes on the energy graph. Also, the erroneous parts of the Power trace are a lot smoother than the correct parts (note the change at around 2s)

  • Rafael:

    Please find attached the trace log and the related Excel file. 

    You'll see the lack of consistency between Energy and Current.

    Again, I'm using the XDS110 JTAG Debug Probe TMDSEMU110-U.

    EnergyTrace_2018_08_10_091957.zip

  • Rafael,

    Having a closer look at the graphs shows the same problem.

    • Both graphs start at 5134.5 ms (green bar).
    • But the Energy graph stops at 5138.3 ms (red bar) while the Current graph continues toll 5138.6 ms (orange area).
    • The Energy graph doesn't report extra usage between 5138.3 and 5138.6 ms as the cyan line is parallel to the cyan line previous to 5134.5 ms.

  • Olivier,

    In conversations with the dev team, they pointed out the reference below that discusses an intrinsic loss of accuracy intrinsic to the DC-DC method of energy measurement. This is mentioned in section 4.4 of the Code Composer Studio v8 IDE for MSP430 MCU:

    Q: When capturing in EnergyTrace mode, the min and max values for power and current show deviation, even though my program is the same. I would expect absolutely the same values.

    A: The energy measurement method used on the hardware counts dc-dc charge pulses over time. Energy and power are calculated from the energy over time. Due to statistical sampling effects and charge and discharge effects of the output voltage buffer capacitors, it is possible that minimum and maximum values of currents vary by some percent, even though the program is identical. The captured energy, however, should be almost equal (in the given accuracy range).

    The text above indicates the energy measurement has some residual capacitance which tends to create some hysteresis at lower energy values. 

    I was busy these past days and couldn't yet test Robert's proposition, but I will do as soon as possible. 

    Regards,

    Rafael

  • I did another test using a standalone EnergyTrace command line tool based on source code I found here:

    https://43oh.com/2017/03/pipe-energytrace-data-to-gnuplot/

    https://github.com/carrotIndustries/energytrace-util

    This tool does not interact with CCS itself, but directly communicates with the emulator using the same MSPDS library that CCS uses.

    The standalone tool produced the same current trace errors as CCS, so that means the problem must be upstream.

    I took a look at the source code for the MSPDS library and found that it contains he code to calculate energy and current values based on pulse counts from the emulator. The emulator firmware doesn't output current measurements directly.

    I expect MSPDS is maintained by the MSP platform team, so perhaps we should move the thread over there for further discussion.

  • Indeed, calculating instant Energy (uJ) or d Energy / dt (nA) from cumulated Energy (uJ), and then converting it into nA gives the following graph:

    • Current (nA): direct EnergyTrace measure 
    • d Energy / dt (nA): calculated value from EnergyTrace cumulated Energy (uJ) measure

    I suggest to add the calculated value d Energy / dt (nA) to the CCS EnergyTrace graphs.

    Figures come form the zipped Excel file I posted before at Tue, Aug 14 2018 9:30 AM.

    .

  • I tried the same process on your csv file with the same result.

    Unfortunately the results on my own example data were quite poor; the current calculated from the energy values had a lot of noise.

    In any case, I think it would be best to get the bug in the MSPDS library fixed so it returns a correct current trace to the IDE.

  • Robert Cowsill said:

    I did another test using a standalone EnergyTrace command line tool based on source code I found here:

    https://43oh.com/2017/03/pipe-energytrace-data-to-gnuplot/

    https://github.com/carrotIndustries/energytrace-util

    This tool does not interact with CCS itself, but directly communicates with the emulator using the same MSPDS library that CCS uses.

    I tried to build the utility but it failed on macOS. Which OS are you using? 

  • I'm on Windows and used Visual Studio 2017 community to build. I had to set up the project files myself and make some fixes as the original source assumes it's being built for Linux.
  • I found another post about the same issue from 2016, by someone writing a standalone energytrace tool using MSPDS:

    e2e.ti.com/.../1731837

    As an aside, I've now got set up to build the open source MSPDS, so I can debug the host-side EnergyTrace processing that is producing these artifacts in the output.
  • (for others following this thread)

    In internal discussions it was verified the EnergyTrace technology built into the XDS110 Debug Probe (both in Launchpads and the standalone TMDSEMU110-U) performs averaging on the Energy measurements, which lead to the effect discussed in this thread.

    To completely remove this effect, the add on EnergyTrace HDR (TMDSEMU110-ETH) is required.

    Regards,
    Rafael
  • Rafael: Thank you for your investigation and the detailed answer. I'll use the TMDSEMU110-ETH for more reliable current measures.

  • I looked into this further, and the problem does indeed originate upstream of CCS.

    It is not an inherent limitation of the filtering algorithm, however. There's a bug in the implementation of the filter in the MSPDS and XDS emupack drivers that are used to access the energytrace data from the emulator.

    See the following thread on the MSP forum: https://e2e.ti.com/support/microcontrollers/msp430/f/166/t/727319