Part Number: TM4C123GH6PM
Other Parts Discussed in Thread: EK-TM4C123GXL
Tool/software: Code Composer Studio
I am developing a large complex program that became difficult to debug a few months ago because the debugger started stopping often (after running for less than a second) at seemingly random "phantom breakpoints". Telling it to continue running worked consistently. The program ran fine if I pressed Stop to disconnect the debugger. Disabling all breakpoints didn't help. Deleting all breakpoints I had set didn't help. There is a lot more to the story, but it may be irrelevant, so I'll jump to the end and backtrack if needed.
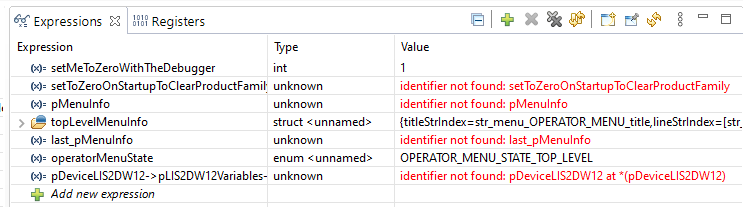
Today I switched one of the panes in the debug view from showing Expressions to showing a Memory Browser (so I could check stack usage) and it started working perfectly, breaking at intentional breakpoints but never at a "phantom" breakpoint. Switching back to the Expressions tab made the phantom breakpoints reappear. I suspect a timing issue in CCS, but don't know how to pursue that any further. I am using a TM4C123 Launchpad connected directly (no USB hub) to the front of my PC.
Displaying the Memory Browser is a simple workaround for my issue, but I would be glad to help track down the root issue if someone will tell me how to proceed.
Steve