Tool/software: WEBENCH® Design Tools
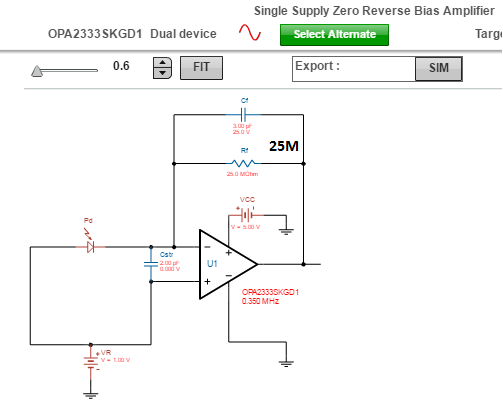
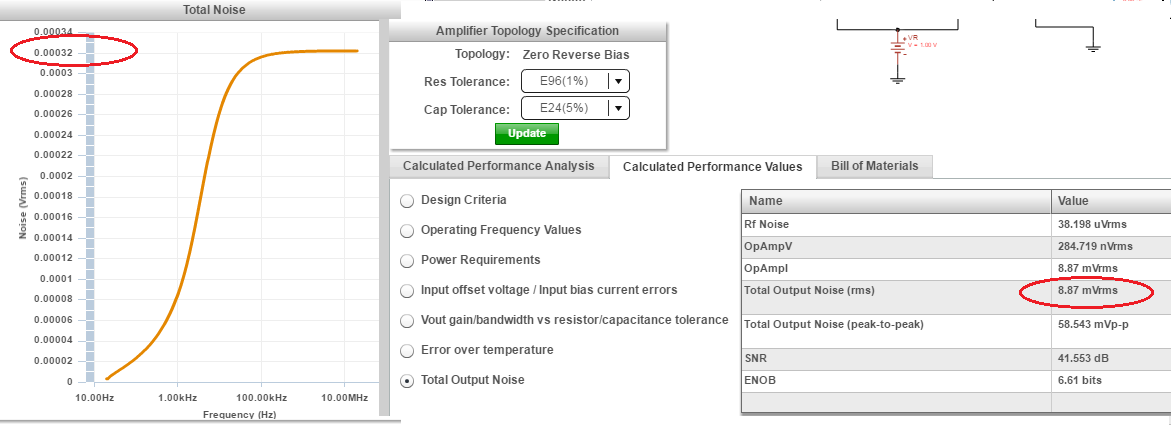
I have a WEBENCH TIA for photodetector design. When comparing the Calculated Performance Analysis -> Total Noise graph with Calculated Performance Values -> Total Output noise, there seems to be no clear correlation between the two results or at least I don't get it. See below extract from a (random) design.
The Total noise curve I interpret as a display of the total output noise versus measurement bandwidth from DC and up to the noise bandwidth of your downstream system. I e. the curve is _not_ the noise density (among other due to the y-axis unit). Is this correct? So with say DC to 10MHz noise bandwidth the graph says that the total noise is 0.32mVrms. But the table says 8.87mV rms.
To illustrate how I think to read the curve: had the bandwidth been DC-1kHz, the curve suggests a total noise of 0.08mVrms
What am I missing here?
Sorry if this is not the right forum, but this seemed the most appropriate I was able to find.