This thread has been locked.

If you have a related question, please click the "Ask a related question" button in the top right corner. The newly created question will be automatically linked to this question.

BOOSTXL-AOA: Explain parts of AoA Log file

Part Number: BOOSTXL-AOA

Hello,

I am trying to understand the logfile being emitted from the SimpleLink RTLS AoA development kit.  I have the BOOSTXL-AOA attached to a CC26x2 development board as the receiver and another CC26x2 acting as a transmitter.  The board with the BOOST antenna is generating the log file, and I have done the necessary capacitor mod on the CC26x2 to interface to the BOOSTXL antenna board.

Using the unmodimied ( except the COM port) python script rtls_aoa_iq_with_rtls_util_export_into_csv.py, it generates a CSV that is 1149 lines long, 1148 of those lines have data.

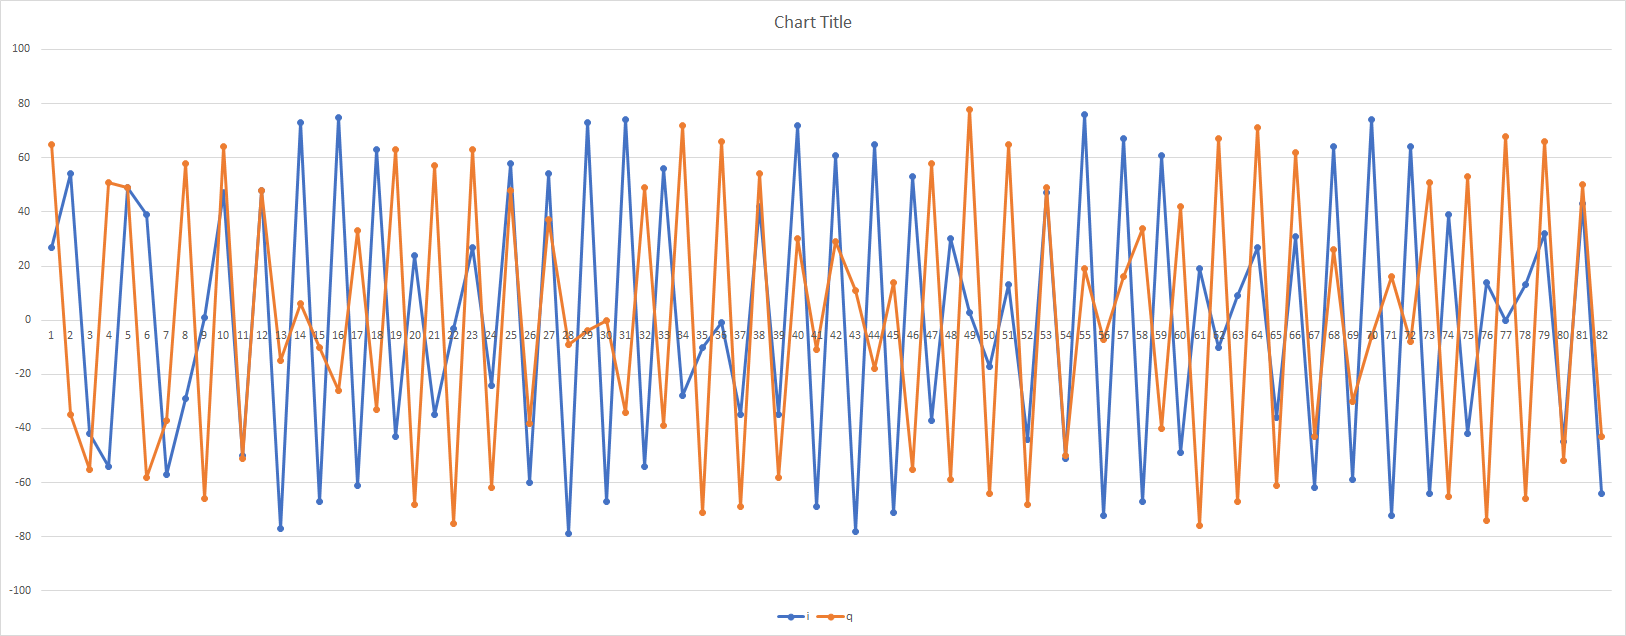
I am assuming that a full CTE measurement block is considered 1 packet -- designated as 'pkt' in the CSV file.  If that is the case, I get 82 rows of data. each row has 1  I/Q measurement paring.  If I take this data and plot it in Excel, it does not look like the examples on the TI website.  Can you please explain what is happening?

My configuration from the python file:

connect_interval_mSec = 500 # 100

aoa_params = {
                    "aoa_run_mode": "AOA_MODE_RAW",  ## AOA_MODE_ANGLE, AOA_MODE_PAIR_ANGLES, AOA_MODE_RAW
                    "aoa_cc2640r2": {
                        "aoa_cte_scan_ovs": 4,
                        "aoa_cte_offset": 4,
                        "aoa_cte_length": 20,
                        "aoa_sampling_control": int('0x00', 16),
                        ## bit 0   - 0x00 - default filtering, 0x01 - RAW_RF no filtering - not supported,
                        ## bit 4,5 - 0x00 - default both antennas, 0x10 - ONLY_ANT_1, 0x20 - ONLY_ANT_2
                    },
                    "aoa_cc26x2": {
                        "aoa_slot_durations": 1,
                        "aoa_sample_rate": 1,
                        "aoa_sample_size": 1,
                        "aoa_sampling_control": int('0x10', 16),
                        ## bit 0   - 0x00 - default filtering, 0x01 - RAW_RF no filtering,
                        ## bit 4,5 - default: 0x10 - ONLY_ANT_1, optional: 0x20 - ONLY_ANT_2
                        "aoa_sampling_enable": 1,
                        "aoa_pattern_len": 3,
                        "aoa_ant_pattern": [0, 1, 2]
                    }
                }

Plotting the IQ data in excel shows this:

and the Rows of data:

identifier pkt sample_idx rssi ant_array channel i q
80:6F:B0:EE:AE:D6 0 0 -79 1 9 -37 -53
80:6F:B0:EE:AE:D6 0 1 -79 1 9 -50 23
80:6F:B0:EE:AE:D6 0 2 -79 1 9 29 52
80:6F:B0:EE:AE:D6 0 3 -79 1 9 51 -28
80:6F:B0:EE:AE:D6 0 4 -79 1 9 -36 -45
80:6F:B0:EE:AE:D6 0 5 -79 1 9 -46 33
80:6F:B0:EE:AE:D6 0 6 -79 1 9 38 47
80:6F:B0:EE:AE:D6 0 7 -79 1 9 40 -42
80:6F:B0:EE:AE:D6 0 8 -79 1 9 -35 47
80:6F:B0:EE:AE:D6 0 9 -79 1 9 7 -79
80:6F:B0:EE:AE:D6 0 10 -79 1 9 -7 76
80:6F:B0:EE:AE:D6 0 11 -79 1 9 35 -58
80:6F:B0:EE:AE:D6 0 12 -79 1 9 -16 77
80:6F:B0:EE:AE:D6 0 13 -79 1 9 2 -74
80:6F:B0:EE:AE:D6 0 14 -79 1 9 -33 60
80:6F:B0:EE:AE:D6 0 15 -79 1 9 -8 -79
80:6F:B0:EE:AE:D6 0 16 -79 1 9 21 71
80:6F:B0:EE:AE:D6 0 17 -79 1 9 16 -62
80:6F:B0:EE:AE:D6 0 18 -79 1 9 7 77
80:6F:B0:EE:AE:D6 0 19 -79 1 9 -12 -81
80:6F:B0:EE:AE:D6 0 20 -79 1 9 -22 62
80:6F:B0:EE:AE:D6 0 21 -79 1 9 -20 -82
80:6F:B0:EE:AE:D6 0 22 -79 1 9 32 64
80:6F:B0:EE:AE:D6 0 23 -79 1 9 2 -62
80:6F:B0:EE:AE:D6 0 24 -79 1 9 31 70
80:6F:B0:EE:AE:D6 0 25 -79 1 9 -21 -70
80:6F:B0:EE:AE:D6 0 26 -79 1 9 -11 63
80:6F:B0:EE:AE:D6 0 27 -79 1 9 -37 -66
80:6F:B0:EE:AE:D6 0 28 -79 1 9 45 64
80:6F:B0:EE:AE:D6 0 29 -79 1 9 -7 -58
80:6F:B0:EE:AE:D6 0 30 -79 1 9 49 61
80:6F:B0:EE:AE:D6 0 31 -79 1 9 -48 -56
80:6F:B0:EE:AE:D6 0 32 -79 1 9 10 62
80:6F:B0:EE:AE:D6 0 33 -79 1 9 -53 -62
80:6F:B0:EE:AE:D6 0 34 -79 1 9 53 50
80:6F:B0:EE:AE:D6 0 35 -79 1 9 -22 -63
80:6F:B0:EE:AE:D6 0 36 -79 1 9 62 47
80:6F:B0:EE:AE:D6 0 37 -79 1 9 -63 -36
80:6F:B0:EE:AE:D6 0 38 -79 1 9 26 58
80:6F:B0:EE:AE:D6 0 39 -79 1 9 -60 -52
80:6F:B0:EE:AE:D6 0 40 -79 1 9 63 44
80:6F:B0:EE:AE:D6 0 41 -79 1 9 -35 -53
80:6F:B0:EE:AE:D6 0 42 -79 1 9 71 36
80:6F:B0:EE:AE:D6 0 43 -79 1 9 -71 -18
80:6F:B0:EE:AE:D6 0 44 -79 1 9 51 38
80:6F:B0:EE:AE:D6 0 45 -79 1 9 -75 -28
80:6F:B0:EE:AE:D6 0 46 -79 1 9 68 20
80:6F:B0:EE:AE:D6 0 47 -79 1 9 -49 -44
80:6F:B0:EE:AE:D6 0 48 -79 1 9 75 25
80:6F:B0:EE:AE:D6 0 49 -79 1 9 -76 -13
80:6F:B0:EE:AE:D6 0 50 -79 1 9 53 31
80:6F:B0:EE:AE:D6 0 51 -79 1 9 -78 6
80:6F:B0:EE:AE:D6 0 52 -79 1 9 74 -2
80:6F:B0:EE:AE:D6 0 53 -79 1 9 -54 -35
80:6F:B0:EE:AE:D6 0 54 -79 1 9 77 3
80:6F:B0:EE:AE:D6 0 55 -79 1 9 -73 5
80:6F:B0:EE:AE:D6 0 56 -79 1 9 58 30
80:6F:B0:EE:AE:D6 0 57 -79 1 9 -76 15
80:6F:B0:EE:AE:D6 0 58 -79 1 9 69 -22
80:6F:B0:EE:AE:D6 0 59 -79 1 9 -64 -9
80:6F:B0:EE:AE:D6 0 60 -79 1 9 77 -10
80:6F:B0:EE:AE:D6 0 61 -79 1 9 -74 15
80:6F:B0:EE:AE:D6 0 62 -79 1 9 60 5
80:6F:B0:EE:AE:D6 0 63 -79 1 9 -74 31
80:6F:B0:EE:AE:D6 0 64 -79 1 9 61 -40
80:6F:B0:EE:AE:D6 0 65 -79 1 9 -65 8
80:6F:B0:EE:AE:D6 0 66 -79 1 9 65 -40
80:6F:B0:EE:AE:D6 0 67 -79 1 9 -66 37
80:6F:B0:EE:AE:D6 0 68 -79 1 9 63 -5
80:6F:B0:EE:AE:D6 0 69 -79 1 9 -70 36
80:6F:B0:EE:AE:D6 0 70 -79 1 9 56 -47
80:6F:B0:EE:AE:D6 0 71 -79 1 9 -57 26
80:6F:B0:EE:AE:D6 0 72 -79 1 9 51 -63
80:6F:B0:EE:AE:D6 0 73 -79 1 9 -50 52
80:6F:B0:EE:AE:D6 0 74 -79 1 9 60 -19
80:6F:B0:EE:AE:D6 0 75 -79 1 9 -56 56
80:6F:B0:EE:AE:D6 0 76 -79 1 9 47 -58
80:6F:B0:EE:AE:D6 0 77 -79 1 9 -56 34
80:6F:B0:EE:AE:D6 0 78 -79 1 9 38 -68
80:6F:B0:EE:AE:D6 0 79 -79 1 9 -27 70
80:6F:B0:EE:AE:D6 0 80 -79 1 9 54 -38
80:6F:B0:EE:AE:D6 0 81 -79 1 9 -39 69

I have been following the directions for the development kit and haven't made any modifications for it. 

If I put a logic analyzer on the antenna switching pins and run the above python script, I see I get 15 groups of pulses separated by ~200mS. Within one group, I see 74 pulses showing the active time of one antenna. Each active time is 2uS. 

I am having a hard time corelating which of this data is antenna measurement, which of it is switching time, which of it is guard period and which is reference period.  

Can you please call out what might be happening in this log file, per row?

Thanks!

-Ben

  • Hi Ben,

    First of all, the details you have provided do not show any issue. I am not sure if the question is coming from a confusion between IQ data and angle. With the configuration used (especially "aoa_run_mode": "AOA_MODE_RAW"), you ask the device to provide all the IQ samples, not to compute an angle. Could you please re-attach the graph you are getting? (E2E does not support copy-pasting pictures, you need to use the icons to attach the image).

    Regarding antenna switching, I advice you to have a look to the BLE Stack User's guide first. I will then be able to help a bit more by looking at your graphs.

    Best regards,

  • Hi Clément,

    Specifically I was asking how to parse  the logfile output, I am not asking how to compute the angle, only how to tease out GOOD IQ samples.  Pouring through the forums here, it seems that I should be rejecting a portion of the first samples because its the reference period, then I should be rejecting some of the samples because they are during the antenna switching period?

    What I would like from you is guidance as to WHICH samples need to be rejected(i.e., rows 1-30 are ref period, rows 34, 38 42 are good Antenna1 data, etc..), given an unmodified SDK example (setting that are shown in my first post).  If I run the rtls_aoa_iq_with_rtls_util_export_into_csv.py script, it generates the same quantity of samples every time -- 1148.  Given that the RAM buffer on the CC26x2 cannot hold that many samples, I am to believe that multiple CTE Packets have been sampled.  This leads me to reason that one packet grouping of samples which has 82 measurements in the log file is the measurements taken from a single TXd  packet CTE. 

    I have gone through the Stack users guide, and it was helpful. I have tried teasing out the data assuming an interleaved nature in the log file, but that is not giving expected results

    Given all the above, I would appreciate guidance of which samples are good IQ data, which samples are switching times, and which are reference period.

    I am attaching a graph of the first 82 samples of the above data. As you can see its not making a lot of sense.

    Also, if I take the ATAN2(Q/I) and plot that, it ALSO doesnt look like anything...

    Thank you,

    -Ben

  • Hi Ben,

    This exact section of the User's Guide tell you which samples should be discarded. Considering you are using a 1us slot with a sampling frequency of 1MHz, you will see that the 8 first samples (reference period) have to be discarded. Then you will see that you have to discard the 9th sample, the 11th, the 13th...

    That being said, I wanted to tell you that the RF switches used on the BOOSTXL-AOA might be too slow to use 1us slots. In addition, to work properly with the IQ samples, I recommend to run the tests in an anechoic chamber or to do conductive tests (not over the air).

    Best regards,

  • Hi Clément,

    Thanks for the link to the packet layout. I had seen that before, but I think I am discovering the source of confusion.  Within the configuration section of the python, does this section come into play at all?

                        "aoa_cc2640r2": {
                            "aoa_cte_scan_ovs": 4,
                            "aoa_cte_offset": 4,
                            "aoa_cte_length": 20,
                            "aoa_sampling_control": int('0x00', 16),
                            ## bit 0   - 0x00 - default filtering, 0x01 - RAW_RF no filtering - not supported,
                            ## bit 4,5 - 0x00 - default both antennas, 0x10 - ONLY_ANT_1, 0x20 - ONLY_ANT_2
                        },

    From your responses, I am guessing the above is completely ignored?  If so, what is the recommended settings for the section "aoa_cc26x2": { within the python file if 1uS is not recommended with the BOOSTXL-AOA kit? ( which begs the question why its set like that as the default setting of the TI dev kit...)

    Thanks for your help,

    -Ben

  • Hi Ben,

    I confirm, the code snippet you mentioned is not used when running the example with CC26x2 devices.
    I recommend the code below:

                        "aoa_cc26x2": {
                            "aoa_slot_durations": 2,
                            "aoa_sample_rate": 1,
                            "aoa_sample_size": 1,
                            "aoa_sampling_control": int('0x10', 16),
                            ## bit 0   - 0x00 - default filtering, 0x01 - RAW_RF no filtering,
                            ## bit 4,5 - default: 0x10 - ONLY_ANT_1, optional: 0x20 - ONLY_ANT_2
                            "aoa_sampling_enable": 1,
                            "aoa_pattern_len": 3,
                            "aoa_ant_pattern": [0, 1, 2]
                        }
    

    Best regards,

  • Hi Clément ,

    Your setting work great, I am getting more expected values out of the unit now.

    Question: On the aoa_sample_control, if I change the value to 0x00, it sets it to the RAW_RF output, and I get MANY more samples than I did with it set to 0x10. Can you comment on the additional samples? All other settings are the ones you have just suggested.

    Thanks,

    -Ben

  • Hi,

    As its name suggest "RAW_RF" output does not apply any filtering on the data hence a significantly higher amount of data.

    Regards,

  • Hi Clément,

    Well, thats fairly obvious from the size of the logfile.  But the sample output doesnt track with the settings.  Can you please explain the format of the output data?   For instance, the first X samples are the reference period, then the next Y samples are switching time, then the next Z samples are valid data... etc..  I want to know how to pick out the valid samples from the log file with RAW_RF set.

    Thank you,

    -Ben

  • Hi Ben,

    It should be the same principle as before with the User's Guide telling you which samples should be discarded (the same samples should be kept / discarded as in default filtering mode).

    Best regards,

  • Thanks for posting the users guide, again, for reference. However this isn't telling me why I have 13x more samples.  At most I was expecting a 2x increase, anticipating the switching samples to be output.

    From the section under INTEGRATION comes this little snippet:

    For rtls_master, the I/Q sampleRate Setting is configurable and it’s from 1MHz up to 4MHz. Each I/Q pair occupies 32 bits space in radio RAM and the radio RAM can store up to 624 samples (2496 bytes - around 2.5kB). When the sampling frequency is maximum (4 MHz), exactly 624 samples are stored during each CTE. (The CTE lasts 160 us, minus 4 us of guard period. When sampling frequency is 4 MHz, in 156 us, 156*4 = 624 samples are stored. More details are provided in Valid I/Q Samples For Angle Calculation.)

    However you can CLEARLY see that I have set my settings to sample at 1MHz("aoa_sample_rate": 1).  Does this mean that when "aoa_sampling_control" is set to int('0x11', 16) which is 0x01 - RAW_RF no filtering, that somewhere in the code, it now ignores my python configuration of 1MHz and gets set to 4MHz? If so, where is that warning or directive?

    Thanks,

    -Ben

  • Hi Ben,

    You are right, the sampling frequency is now 4MHz, let me explain why.

    So the RAW_RF mode disable all the treatment done on the IQ samples collected (we said it before). This include all the treatments including some filtering. For your information, the radio always sample at 4MHz. When you select a lower sampling frequency (and you are not in RAW_RF mode) the radio filters out some data to reduce the sampling frequency seen - this is disable in RAW_RF mode hence the sampling frequency increased to 4MHz.

    Based on the user's guide, you will still be able to identify the samples that should or should not be kept. Consider the sampling frequency to be 4MHz.

    Best regards,