This thread has been locked.

If you have a related question, please click the "Ask a related question" button in the top right corner. The newly created question will be automatically linked to this question.

CC2642R: Debugging Memory Issues

Part Number: CC2642R

Hi.

I've been debugging a problem with our application (based on SimplePeripheral SDK 4.20.0.35) where the board (custom hardware) hangs after a random number of minutes (between 0-60 Minutes observed) of transmitting (50-60 bytes of data every 125-150ms) with a "Hard Fault: FORCED: BUSFAULT: PRECISERR.Data Access Error". My best guess at the moment is some kind of buffer overrun which is only harmful in some cases. Consequently I've been looking using HeapTrack and the ROV. When the traffic is high the ROV does indeed intermittenly mark some entries in the HeapAllocList as overflown, in some cases even multiple entries seem corrupted. However the entries are always associated with either the Idle Task or the ICall Task. Out of curiosity I've modified the stock SimplePeripheral SDK 4.40.0.44 to use HeapTrack and I'm seeing the same overflown entries when connecting here. I've attached the ROV exports below.

My main question now is: Are these overflows expected, since they also appear in the stock project, and can be disregarded?

Sincerely,

Alex

rov.zip

  • Alex,

    The exception "Hard Fault: FORCED: BUSFAULT: PRECISERR.Data Access Error" is a precise fault, which means the core exception handler is able to know accurately which instruction triggered it.

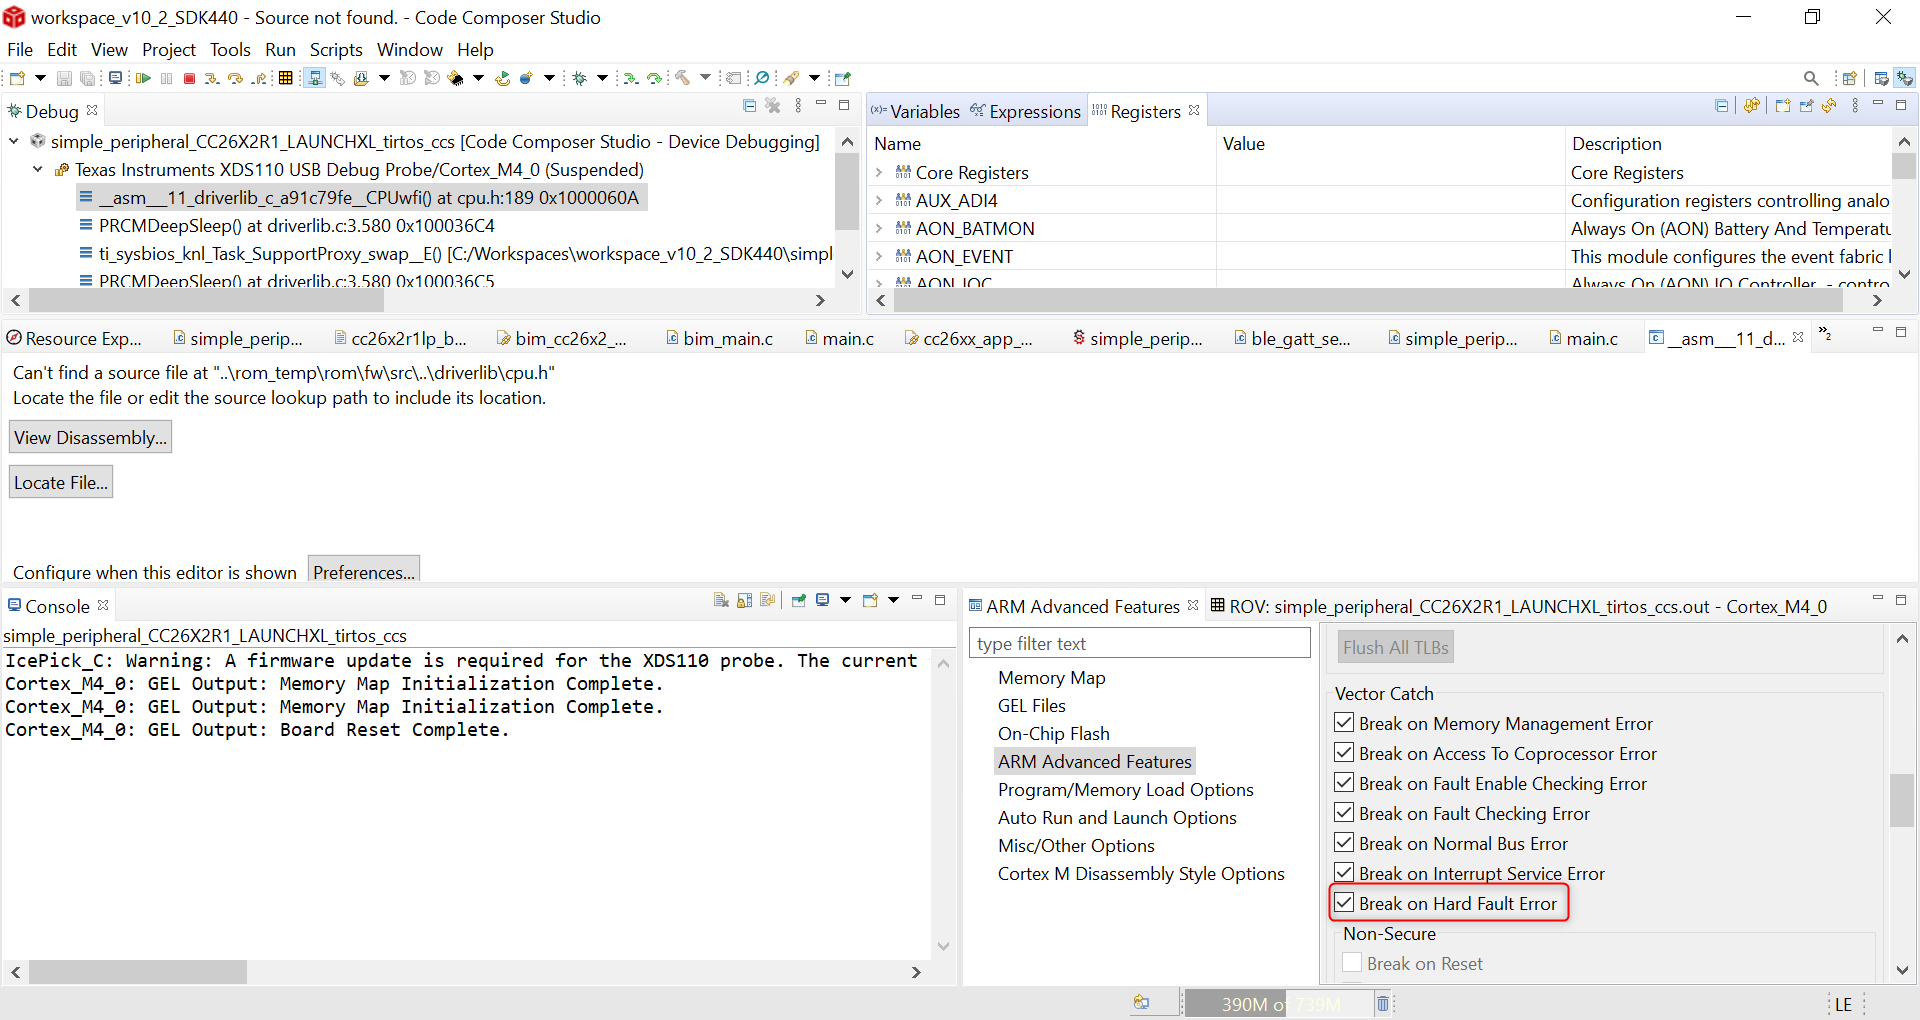
    Thus, by enabling the Vector Catch functions of the CCS IDE (Menu Tools --> ARM Advanced Features), you should be able to set a breakpoint at the Hard Fault Error and rebuild the call stack. You can enable all of them as well, but there may be limitations to the hardware breakpoint count.

    The call stack should be shown in the IDE's Debug view (top left), but there are several other methods reported around the internet that cover this subject (one is shown here). 

    I haven't used the HeapTrack extensively, but I know it requires an increase in Heap to account for the small extra monitors. Additional details are shown in the presentation below:

    https://training.ti.com/sites/default/files/docs/TIRTOS_CCSDebugging.pdf

    I looked at the .json files but, without the code information, I can only see the addresses. The custom_multiple log is the one that seems really broken (the addresses are really off). At any rate, please give the suggestions above a try.

    Hope this helps,

    Rafael

  • Hi.

    I did not know about the possibility of setting those hardware breaktpoints, so that at least has been helpful. However, when the breakpoint is reached, the stack view only shows a single address and "no symbols defined". I've tried using BIOS in flash instead of ROM in hopes of getting more information, but have run into some issues. The combination of BIOS in flash, enabled assertions and HeapTrack as memory manager seems to be doomed from the start. I could not get even the stock SimplePeripheral Project to run with the modified config attached below. Am I doing something wrong here?

    In the meantime I got it to work with just HeapMem instead of HeapTrack, but I'm still waiting for my original error to occur again here. Reading through the heap manager options again, using HeapTrack (with BIOS still in ROM) to debug a previous problem and then not changing back to OSAL might actually be the cause of my current error.

    Sincerely,

    Alex

    simple_peripheral_app.cfg

  • Alex,

    Thanks for the update. I am not entirely sure what may be going on in your case; I am able to run the simple_peripheral normally with TI-RTOS in Flash by using a very similar .cfg as yours - basically commenting out the first five lines of code of the .cfg.

    Even still, with TI-RTOS in ROM you can load symbols and debug it normally. Check the section Debugging --> Loading TI-RTOS Symbols chapter of our User's guide.

    At any rate, please let me know if the issue spikes again. 

    Regards,

    Rafael

  • Hi Rafael,

    thanks for the info on loading the symbols.

    Only the combination of all three: BIOS in flash, enabled assertions (BIOS.assertsEnabled = true) and HeapTrack as heap manager (HEAPMGR_CONFIG = 0x82) did cause issues. After some further looking, this combination does apparently trigger some assertion and thus seems impossible.

    Switching to the OSAL heap manager allowed further debugging, but the original "Hard Fault" has not occured since then. My best guess at the moment is that the HeapTrack manager was the culprit in the first place.

    Sincerely,

    Alex