This thread has been locked.

If you have a related question, please click the "Ask a related question" button in the top right corner. The newly created question will be automatically linked to this question.

AFE4400 KIT probram

Other Parts Discussed in Thread: AFE4490, AFE4400

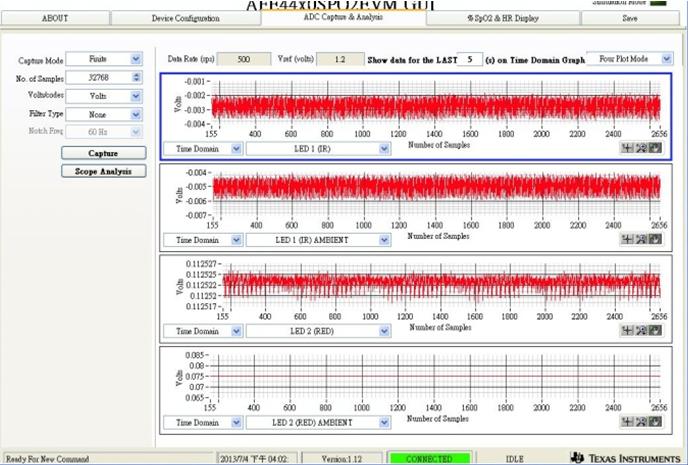
Why oxygen signal reverse???
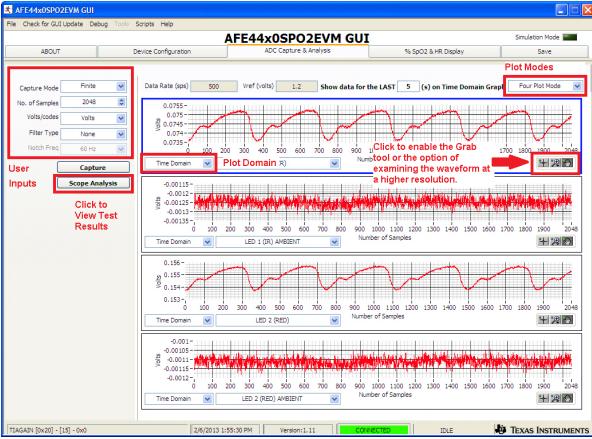
  • The pulse ox waveform you are referring to is blood pressure vs time and at higher pressure, the blood volume is highest resulting in greater attenuation of light and hence the photodiode will receive lower light current and hence the waveform will look inverted.

    A detailed explanation is provided in the document attached.

    0020.PPG Waveform using AFE4400.pdf

  • Have the AFE44x0EVMspo2 the GUI LABVIEW  source code is download ????, Because the execution and found a lot of BUG

  • No, unfortunately we do not provide the LabVIEW GUI source code for download.

    I would really appreciate if you can send us all the bugs you have noticed. Resolving the issues would really help others who are also using the EVM GUI.

  • Hello.

    Sorry for entering in the thread, but I also found a bugs when using evaluation kit for AFE4490. But in my opinion the are coming mainly from the board firmware. For example it frequently freezes when a high amount of data is exchanged. After freezing only disconnecting from the USB returns it in working state. I also found that a higher sample rates are a problem for firmware - I'm not able to use development kit with 1000Hz  Pulse repetition frequency, it freezes after start of acquisition with such a setting.

    One useful feature which is not available (or I cannot find a way to do it) will be the possibility to display the curve in continuous mode, but without auto-scaling feature.  This will give an information about the "zero line" of the signal related to total ADC range. This is important to select the right value of TX current and RX amplification, to position the signal in the middle of the range.

  • Hi,

    The bug in firmware at higher sample rate was resolved in latest firmware revision. Can you verify if you are using the latest revision of software GUI and firmware?

    The latest revision of

    • GUI is 1.12
    • Firmware is1.2

    Section 6 in the users guide describes the procedure for the firmware upgrade.

    Autoscale feature on the plot can be disabled by right clicking anywhere on the plot and unchecking Autoscale X or Autoscale Y.

    The GUI does not support configuring the AFE registers during a data capture.

  • the 1.12 Gui is have bug 

    and i am test green led sensor and PD , but AFE4400 single is  very small

  • Hello Praveen.

    You are right I'm using an old GUI and firmware. My GUI is 1.11, and firmware is 1.0. So, I have downloaded the latest GUI (1.12).

    But, I have a problem to upgrade firmware on EVM board. Following chapter 6 from the manual, a have made an upgrade of the firmware. But after this the windows recognizes my board like a HID device. No more virtual com ports after this upgrade. The GUI cannot recognize the dev board any more, so I'm not able to return the old firmware also.

    Is this a normal behavior of the latest firmware - to work like a HID device? If yes, why GUI cannot recognize the board? If not, how to return the board in functional state?

    Edit: Somehow I was able to reflash it, now everything looks normal. So my question is no more adequate.

  • Hello Yan,

    I am trying to reproduce this error on my end.

    When do you get this error? Do you get this as soon as you start the GUI and click on Capture button under ADC Capture & Analysis or do you change any controls in the GUI before capturing?

    Can you forward the sequence of operations that lead to this error? Do you notice this error message at all times or occasionally?

    Regards

    Praveen.

  • Hello Yan,

    Which Green LED and PD are you using in your design?

    Are you using the green LED and PD in a transmissive setup or in a reflective setup?

    For transmissive application using Green LED you may across two issues:

    1. Green LED has a lower wavelength and hence the depth of penetration is small.

    2. The responsivity of the PD for the Green wavelength is relatively smaller than Red and IR.

    See a typical spectral response of the PD below:

    Hence you may need to increase the LED current to a higher value.

    For reflective sensor application, though Green LED is an advantage because of the depth of penetration, the mechanical setup is really an important aspect that needs to be considered.

    One of the major design consideration is determining the optimum distance of separation between LED and PD.

    There are two methods to improve the quality of the PPG signal.

    1. Increase the LED driving current.

    2. Place the PD closer to the LED.  If the PD is placed too close to the LED, then the PD will be saturated due to the large DC component due to multiple scattering effect.

    This is a trade-off between distance of separation and LED current.

    Regards

    Praveen.

  • Hello Tsvetan,

    Thanks for the update.

    If you have any questions or issues please let me know. I will be happy to help.

    Regards

    Praveen.

  •  A1:   Set the capture mode to  continuous  and  Run longer than 5-10 minutes ,   Error occurs

    Q2 : the green led + green PD (2MM) ,   run AFE4400 GUI  ,  it is no Signal .   Does TI have tested green LED + PD report???

  • But i am Plug-in a OP(gain = 101)  in the  PD input ,  then AFE4400 GUI have about  one volt signal amplitude

  • Q1  why the AFE44x0SPO2-FE Demonstration Kit User's Guide of page 13 Figure 18. Device Configuration: Tx Stage of the GUI Version 1.8.0.0  and can setup transmitter refersnce voltage???

    Q2  Will you have the  source code  the AFE44x0SPO2-FE Demonstration Kit  of U6  (MPU9150)  

  • Hello Yan,

    I am unable to replicate the error that you are noticing.

    See below the PPG signals I captured for more than 15 minutes with the EVM default settings and capture mode set to continuous.

    How frequently are you getting the error?

    Can you get try to capture on a different PC and see if you are still getting this error?

  • We do not have any report testing with Green LED and PD.

    But we have customers who have used AFE4400 device with Green LED and PD.

  • 1. Please download the latest revision of the AFE44x0SPO2EVM user's guide (http://www.ti.com/lit/ug/slau480a/slau480a.pdf). In the latest revision, Figure 18 is in page 16 and it shows the Tx stage sub-tab of Device Configuration tab for AFE4490 device. Transmitter reference (TX_REF) voltage is programmable in AFE4490 device only. The AFE4400 TX_REF is fixed to optimize for 3V to 3.6V operation.

    2. No we do not have the source code for the accelerometer MPU9150 in the AFE44x0SPO2EVM. We provided only the footprint for the part in the EVM so that the users can develop their own software.

  • Dear Praveen,

    I have faced some problems; please kindly assist me!

    1) when I wanted to start the "AFE44x0SPO2EVM GUI" program, it was giving " the ..GUI has stopped working".

         I solved the problem by changing as english "Windows region&llanguage setting " 

    2) An another problem is below;

    When I wanted to take the measurement from SPO2 probe, I faced "error" in the following.  


  • Hello Ozkan,

    Normally this error occurs as a timeout error when the EVM is not responding with any data during a data capture.

    Can you please check the GUI version (located in the bottom status bar) and the firmware revision (located in Global Settings sub-tab under Device Configuration tab)?

    Did you notice similar problem when you did a data capture under ADC Capture & Analysis tab?

    Can you use the GUI to write and read from the AFE registers?

    Did you make changes to the AFE registers? If so, what are your register settings?


    Best Regards.

  • Dear Praveen,

    Thank you for information. When I updated firmware, the error solved.

    However, I have an another problem.

    " %SpO2 & HR Display " tabs  can not measure true heartbeat and take any oxygen saturation value. Below; 

    please advice me!

    regards,

    Özkan

  • Hello Ozkan,


    Did you use your own sensor or the finger clip sensor that comes with the kit to perform the measurement?

    It seems like the filtered signal has no pleth data. That is the reason why the heart rate is off the charts. %SpO2 is displayed only when the value is greater than 85%. With no pleth data, SpO2 did not meet the criteria for display.

    Can you post the raw data taken using the ADC Capture & Analysis tab?

    I would also like to point out that the current GUI version (V1.13) that you are using is still in works and that we will release the official version (V1.13) soon.


    Best Regards.

  • Hello Praveen,

    I used the finger clip sensor that comes with the kit.

    thank you.

    Raw data are below;

    Number of Samples - CH1 Volts - CH1
    30274 0.00533638
    30275 0.00482597
    30276 0.0043808
    30277 0.00404148
    30278 0.00176296
    30279 0.0033823
    30280 0.00413074
    30281 0.00459423
    30282 0.004846
    30283 0.00709248
    30284 0.00536098
    30285 0.00464058
    30286 0.00431213
    30287 0.00409184
    30288 0.00158844
    30289 0.00332909
    30290 0.00404263
    30291 0.00454102
    30292 0.00472755
    30293 0.00711079
    30294 0.0055727
    30295 0.00482941
    30296 0.00432186
    30297 0.00413933
    30298 0.00160446
    30299 0.00334568
    30300 0.00415363
    30301 0.0045908
    30302 0.00471554
    30303 0.00709763
    30304 0.00551434
    30305 0.00480022
    30306 0.00438595
    30307 0.00411587
    30308 0.00162163
    30309 0.00339317
    30310 0.00427837
    30311 0.00473099
    30312 0.00472755
    30313 0.00722065
     
  • A kindly reminder.
  • Hello Ozkan,

    I have sent you an email to take this offline.


    Regards

    Praveen.

  • Hello praveen, Have you recieved the kit i sent back ? My email: ozkan.pehlevan@gmail.com
  • Hello Ozkan,

    Yes I received the kit and fixed the issue. Please provide a shipping address to send the kit back to you.


    Regards

    Praveen.

  • Hello Praven,

    I have received fixed AFE 4400 EVM KİT. I run it. It's OK now.

    But I have a question;

     This EVM kit read info from 6 channels [ redled, ambient redled, IRled, ambient IRled, (redled- ambient redled),   

     (IRled- ambient IRled) ]

    How does  SpO2 value calculate from these data?

    For example; SpO2(SaO2) = Redled/ IRled or (redled- ambient redled) / (IRled- ambient IRled) or something else?

    thank you.

    regards,

    Özkan


  • Hello Ozkan,

    Please refer to the link below for a background on SpO2 measurements.

    http://www.ti.com/lit/ug/tidu124/tidu124.pdf

  • Hi Praveen,

    Thank you for the document.

    I have few questions considering the doc and about GUI.

    1. SaO2 =A-B.(R / IR),    A and B are coefficients(constants) that derive from empirical data. but, I need to know which values they are in this softare ?

    2. Once I change the register value in the GUI, it is written into EWM board (for example, LEDCNTRL register value was changed), this value in EWM board is permanent or temporary after the board reset?  

    3.  How can I  change the default values of registers  ?  For example, LEDCNTRL register (it determines led current). normally, its default value is 0x11414, but I want to change it into  0x14242 as default value.

    4. Last question is that "   Why is the heartrate signal in two part in the following pic?

    Thank you.

    Özkan

  • A kindly reminder.

  • Hello Ozkan,

    1. This is a very rough linear fit with A = 100 and B = 33. As a caveat, using these values may not yield accurate results.

    2. The register settings are temporary. With power cycle or board reset, the values are reset.

    3. The EVM default value programmed by the GUI cannot be changed. After the GUI loads, you can always use the Load Config to load your own settings.

    4. The small peak is the dicrotic notch in the typical PPG waveform. You may not notice the dicrotic notch in a reflective application.

  • Hello sir

    i have a question.

    How does  HeartRate(BPM) value calculate from these data?

    RedLed

    ambient RedLed

    IRLed

    ambient IRLed

    thank you.

    Best  Regards,

    Yu-ming

  • Hello,

    Data from one LED is sufficient to calculate the heart rate.

    Follow the link below to understand how heart rate can be calculated from the LED data.

    http://e2e.ti.com/support/applications/high_reliability/f/30/p/350615/1238774.aspx#1238774

  • Hello

    How can I get the spo2 from waveform in the GUI.

  • Hello,

    Please refer to section 6.2 of the document (link below) which outlines the estimation of SpO2 using PPG signals.

    http://www.ti.com/lit/ug/tidu542/tidu542.pdf

    Please note that this estimation is academic and is a first order approximation for calculating SpO2.

    We cannot guarantee accuracy since we don’t know how much more signal processing and what types of calibration is done by end equipment manufactures before presenting the measurement result. Generally speaking the measurement is calibrated against look up table (R-Curve) for the sensor and we don't have r-curve for the sensor calibration.

    Regards

    Praveen.

  • Hello,

       I want to konw how the LED brightness ratio(R/IR) transforms to voltage ratio in section 6.2.Please give me the algorithm. 

    Er zhang.