This thread has been locked.

If you have a related question, please click the "Ask a related question" button in the top right corner. The newly created question will be automatically linked to this question.

CCS: UART Communication

Tool/software: Code Composer Studio

Dears,

I found there is wiki page that introduce how to use UART monitor for debugging at http://processors.wiki.ti.com/index.php/ProgramModelUart_GuiComposer 

My code, run it on launchpadXL-F28069M evm, is downloaded from the above link. But I can' t get expected debug result after using this solution, can you please help on this?

Here's what I have done:

1. I'm sure that my launchpadXL-F28069M is good, because I could get data from UART port after running lauchpad demo code.

2. Downloading c28_uart_monitor code to this EVM.

3. I added UART interface in ccxml file, PORT: COM4, BAUD RATE: 9600, this is because I see the baud rate setting in firmware is 9600.

4. Click On 'Test connection' button, I got a message that " [Start: UARTConnection_0]  Execute the command: The Diagnostic Command is not defined in the connection properties"

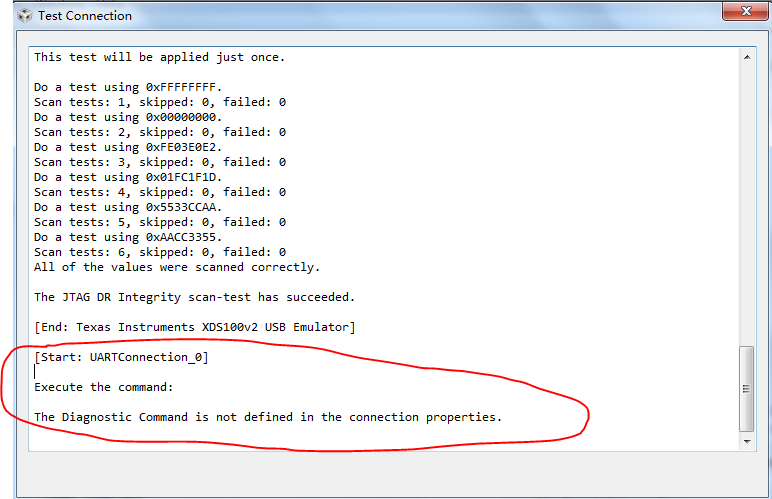
I think I can't get correct message in this step.

5. Launch the above ccxml file, I can't see the variable "error_counter" via UART port. Please see below picture.

6. I'm using CCS6.1.2 version

  • Dears CCS team,

    May I have any update from your side? Thanks in advance.

    Regards,
    Jack
  • Hi CCS team,

    Is there any update about this? I'm waiting for your feedback.

    Regards,
    Jack Tan
  • Jack,

    I apologize for the slow reply. The UART monitor that you have found is something that is used for GUI Composer. GUI Composer is a tool where you can make customer user interfaces that interact with your target application. Those interfaces can use the UART monitor to read and in some cases write memory.

    So you could create a GUI that showed the values of those 2 variables in your screen capture. Is that what you are looking to do or are you looking to debug over UART instead of JTAG due to concerns about halting the target to read memory?

    The UART monitor is not meant to be a debug interface. However 28x devices support real-time accesses. You can refresh the expressions view in CCS and it can read the values without halting the target application. Thus if you are concerned about halting the target

    There is some more information here:
    www.youtube.com/watch
    processors.wiki.ti.com/.../CCS_Modules_Library

    Regards,
    John
  • One other comment. Technically what you have setup would enable you to view global variables. i.e. if ErrorCount and LoopCount were globals that would work. It won't work with local variables. Global variables resolve to a fixed address in memory that the monitor can read.

    John
  • Hi John,

    Thanks for your reply.

    Q: Is that what you are looking to do or are you looking to debug over UART instead of JTAG due to concerns about halting the target to read memory?

    A: Yes, this is the reason why I choose to use UART monitoring. In addition, a isolator will be implemented if using JTAG debug, there is a isolotor in UART interface already. And I just want to implement a few variables, like loop coefficients, output voltage, to view and modified, so I choose to use GUI composer.

    From my question in the first posts, I think you already know that Errorcount and loopcount are global variables, but it can't be viewed and modified in my case. Can you please share some comments about this? I really would like to use UART for debugging due to the cost and safety.

    It seems that TI is not recommended user to use UART monitor tools, Can you please let me know what your concern?

    Regards,
    Jack
  • Jack,

    Thanks for the info.  Using the UART monitor is fine for GUI Composer.  I just wasn't sure if you had found that and were looking to use it as an alternative to JTAG for debugging or if you were looking to do something in GUI Composer.  Debugging over serial interface was pretty common many years ago.  The use case that you described is perfect for GUI Composer.  We just need to figure out why it is not working.

    I will get a F28069M LaunchPad out at get it setup with the example project.

    Regards,

    John

  • Jack,

    Don't worry about the message about the diagnostic command not being defined.  That is expected.  The test connection feature is only used for JTAG connections at this time.

    After launching your debug session did you select the UART Connection in the debug view and then load the symbols from the example project?

    If I don't do that then I will get the same "Error: identifier not found: ErrorCount" message that you get when adding ErrorCount to the Expressions view.  Basically the UART Connection needs to have the symbols associated with it as well.  It doesn't automatically look at the symbols for the 28x core.  This is because when there are multiple cores it wouldn't know which to get.

    Hopefully that is the issue that you are seeing. 

    Once I do that I can add the variable to the expressions view and enable continuous refresh to see the updates

    Regards,

    John

  • Jack,

    Did loading symbols resolve the issue for you?

    John
  • Hi John,

    Thanks for your great support. Yes, this issue has been resolved by loading symbols.

    Thanks again..

    Regards,
    Jack