This thread has been locked.

If you have a related question, please click the "Ask a related question" button in the top right corner. The newly created question will be automatically linked to this question.

CCS/TCI6638K2K: Unable to capture ARM and DSP proper pc trace in board running linux and sysbios

Part Number: TCI6638K2K

Tool/software: Code Composer Studio

Hi,

Details of board: -

SOC:- tci6638K2K

CCS version: 6.1

linux OS: ubuntu 14.04 x64

Ti jtag: xds 560v2

We are running linux kernel  for arm core and on top of that sysbios for DSP core. We want to take the pc trace of ARM and DSP core.

For DSP, I am seeing two observations:

1-> When running dsp sysbios binary from the linux using  mpmcl load dsp1 dsp_image.out; mpmcl run dsp1

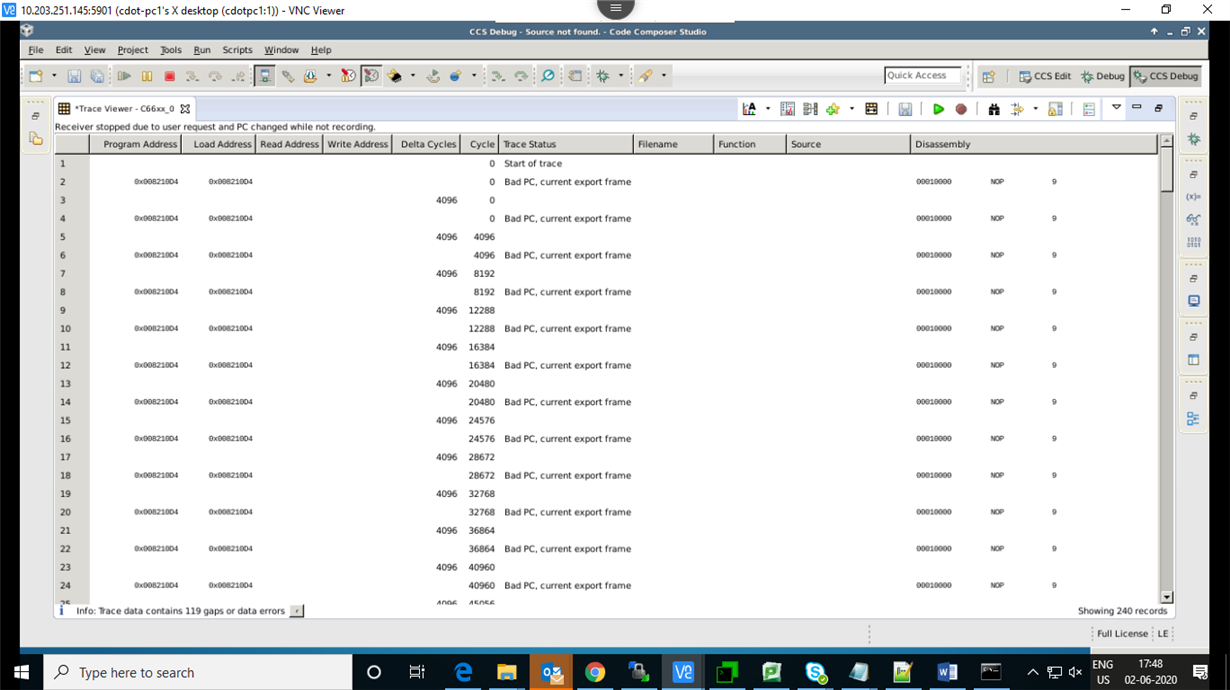
I am getting error as :  "Bad PC, current export frame."

2-> When running dsp sysbios binary directly from jtag, I am getting the proper pc trace.

For Application running on ARM running linux:

I am getting the error : "FIFO overflow, Start of trace, Gap in program flow reconstruction"

0xC051E588 68 207 FIFO overflow, Start of trace, Gap in program flow reconstruction ANDEQ R0, R0, R0, LSR #32 0xC051E588 3.23E+09 0
0xC051E588 275 61 ANDEQ R0, R0, R0, LSR #32 0xC051E588 3.23E+09 0
0xC051E59C 336 113 ANDEQ R0, R0, R0, LSR #32 0xC051E59C 3.23E+09 0
0xC052018C 449 2 ANDEQ R0, R0, R0, LSR #32 0xC052018C 3.23E+09 0
0xC051E5D0 451 4 ANDEQ R0, R0, R0, LSR #32 0xC051E5D0 3.23E+09 0
0xC0054204 455 23 ANDEQ R0, R0, R0, LSR #32 0xC0054204 3.22E+09 0
0xC051E64C 478 4 ANDEQ R0, R0, R0, LSR #32 0xC051E64C 3.23E+09 0
0xC051E80C 482 5 ANDEQ R0, R0, R0, LSR #32 0xC051E80C 3.23E+09 0


Please provide your help on the same.

Thanks,

Rahul Ravi

  • Rahul,

    Some of the images did not go through. Could you resend following the instructions shown at the thread below?

    https://e2e.ti.com/support/site-support/f/1024/t/761613 

    Despite this, I suspect the Linux is not properly funneling data from the ETB to the JTAG. This is performed by the GEL initialization scripts when a "baremetal" connection is made, therefore that would explain why the information you are getting is correct when loading the code directly using the JTAG.

    Another aspect is that Linux may be remapping or protecting memory using the MMU and therefore causing the ETB functionality to fail. Usually the Linux kernel configuration has some build options to allow ETB to work. That would require rebuilding the kernel.

    Unfortunately I don't have the same board as you to try this out, but I will check with device experts if they have additional insights. 

    Regards,

    Rafael

  • Hi, Rahul,

    The DSP image to be downloaded using mpmcl will need to have resource table so ARM Linux knows what areas DSP will be using. It will be different from running the .out file using CCS directly on DSP. For more info on Resource Table, please see section on Resource Custom Table in

    http://software-dl.ti.com/processor-sdk-rtos/esd/docs/latest/rtos/index_Foundational_Components.html#resource-custom-table

    Rex

  • HI Rafael,

    Thanks for the support.

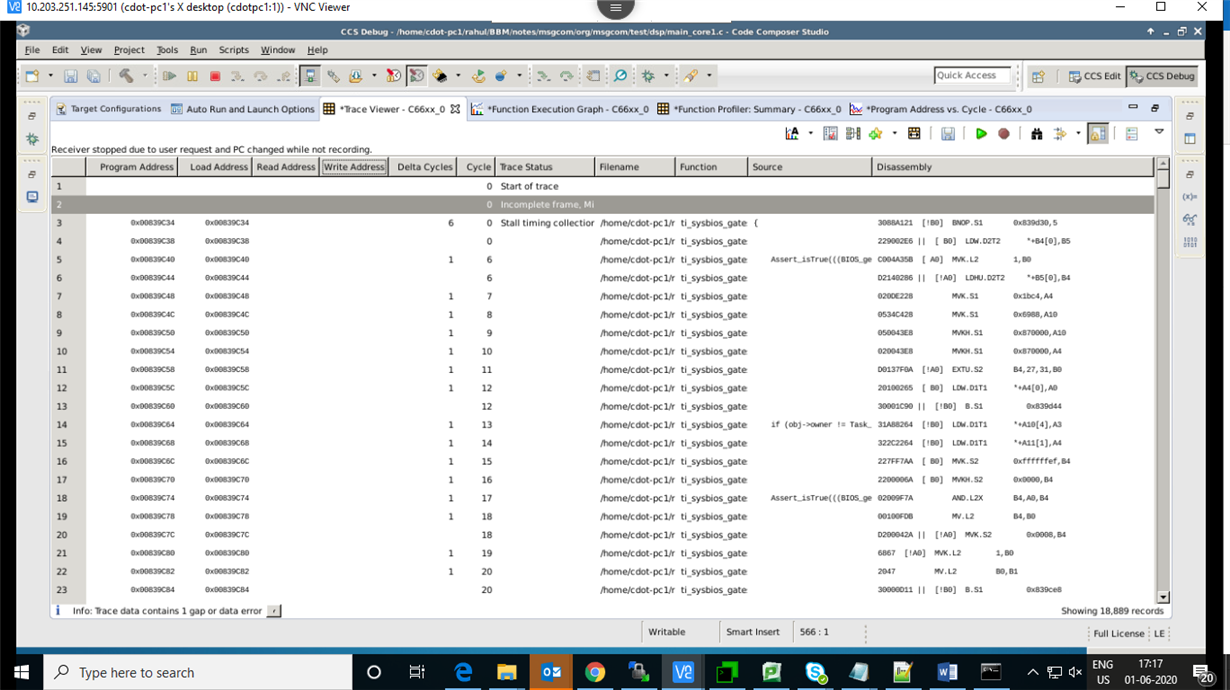
    Please find the attached snapshot

    1-> where dsp  pc trace giving error

    2-> Working dsp pc trace.


  • Rahul,

    Please apologize for the delay and thanks for sending the pictures. The error message indicates there is a corruption in the data received by the Trace GUI and therefore I imagine the Linux configuration may be playing a part corrupting this - did you try to see if the kernel has a configuration to enable ETB? I recall in older kernels this was an option, but I haven't done this in a while. 

    I will try to look for additional scenarios that could potentially trigger that and report back in case I find anything relevant. 

    Regards,

    Rafael

  • Hi Rafael,

    Thanks for the reply. I tried to enable ETB in linux kernel by adding below two config parameters in .config file

    CONFIG_ARM_AMBA=y

    CONFIG_OC_ETM =y

    config OC_ETM
            bool "On-chip ETM and ETB"
            depends on ARM_AMBA
            help
              Enables the on-chip embedded trace macrocell and embedded trace
              buffer driver that will allow you to collect traces of the
              kernel code.

    But while building, CONFIG_ARM_AMBA=y,  CONFIG_OC_ETM =y are removed from the .config file.

    This means both those parameters are not supported by this soc(tci6638K2K).

    Please provide your comment on this, and please guide me on how to enable ETB in kernel.

    Regards,

    Rahul Ravi


  • Hi, Rahul,

    I'll take a look at the Linux configuration, but I am currently busy so the earliest will be some time next week.  

    Rex

  • Hi, Rahul,

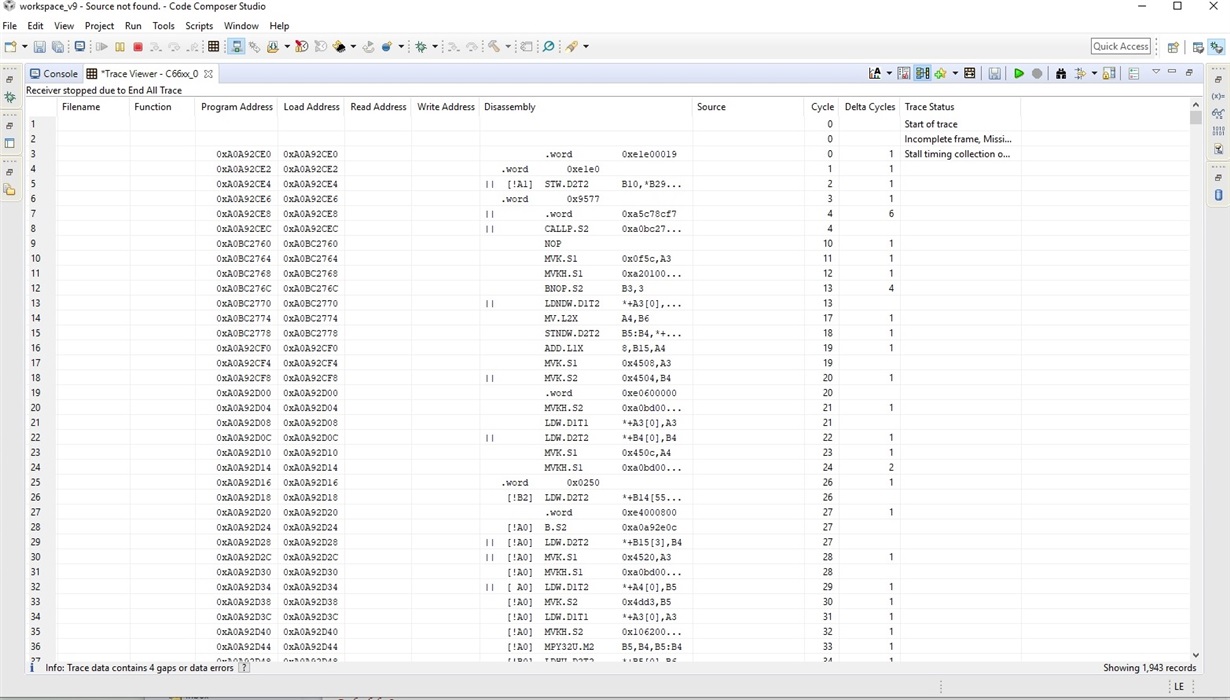
    I don't see the issue. The EVM is running Linux Processor SDK 6.1 release, Kernel 4.19. CCS is 9.1.

    Please see the attached PC trace screenshot.

    Rex

  • Hi Rex,

    I am also able to get pc trace of dsp in decodable format  in case I am loading dsp binary directly from the xds560 emulator.

    But if the dsp binaries are loaded from linux using mpmcl command, I am not able to decode the captured pc trace log.

    For now I am more interested in capturing arm pc trace log which can be decoded.

    Regards,

    Rahul Ravi


  • Hi, Rahul,

    We had an internal discussion on this issue and have a few things would like you to try and also some questions on your issue:

    1) For the nonworking case are you loading the application’s symbols prior to starting the trace session?  If symbols are loaded then the trace decoder will use the .out for the program image as part of decoding….otherwise the trace decoder will be forced to read from memory.  I would recommend that symbols be loaded prior to starting a trace session.

    2) Is the address located in the “Program Address” column of the nonworking case associated with a valid executable code segment in your application? And is the opcode at that location really a NOP 1 (0x00010000) – as noted in the disassembly column?

    3) Does the issue happen with the latest version of CCS? Version 6.1 is pretty old.

    4) Instead of loading your DSP application, could you try loading the prebuilt IPC example. messageq_single.xe66, in /lib/firmware/ipc to see if the issue still happen?

    Thanks!

    Rex

  • Hi Rex,

    Because of time constraint, we are presently focusing on ARM side debugging and finding the cause of hang, so if you can please help with ARM side trace so that we can analysis why ARM goes for hang.

    Regards,

    Rahul Ravi