This thread has been locked.

If you have a related question, please click the "Ask a related question" button in the top right corner. The newly created question will be automatically linked to this question.

RTOS/TDA2PXEVM: IMX390 sensor - problem with image quality and framerate.

Part Number: TDA2PXEVM

Tool/software: TI-RTOS

Hi,


We are using custom made board here. Basically, HW setup is following:
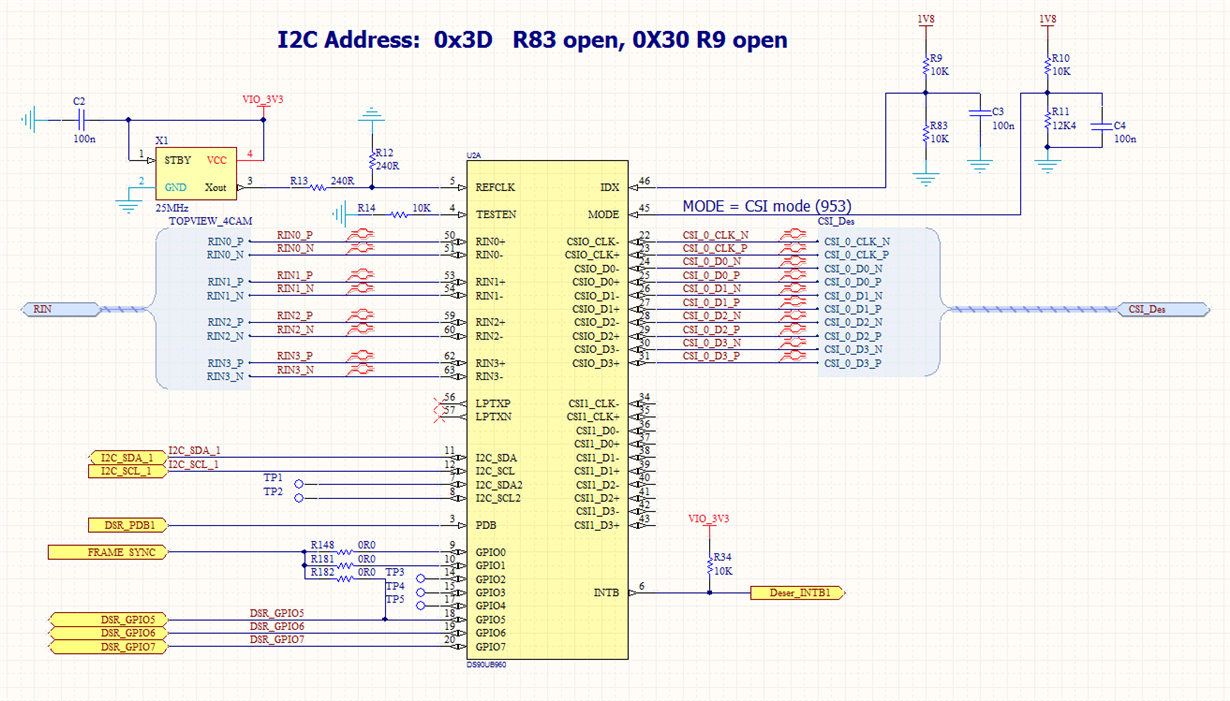
TDA2px + UB960 deserializer + IMI Camera (DS90UB953 + IMX390). Vision SDK version is 3.03.

I had problems capturing data from this sensor - I was unable to see sensor on I2C bus. The problem was following: real address of sensor is 0x1A, not 0x21 and GPIO_1 should be set to high to take sensor out from reset (in iss_sensor_imx390.c file GPIO_0 was used). I'm not sure why these differences exist, maybe different revision of sensor or something like that.

After applied this changes I'm able to capture video from camera, but image quality is very bad and frame rate is not 60 fps, it varies from 5 -20 fps (use provided link to download video). Can you help me with this problem? Could sensor configuration be wrong?

Download video: dl.rt-rk.com/

Regards,
Stefan.

  • Hi Stefan,

    IMX390 is used in our SRV usecase and it is working fine at 30fps frame rate.
    Since you are not getting correct frame rate, can you check reference input clock to the sensor?
    How is it provided? is there a crystal on board or is it derived from serializer?

    Rgds,
    Brijesh
  • Hi Brijesh,

    There is 25 MHz crystal on board.

    Regards,

    Stefan.

  • Hi Stefan,

    I was asking about the IMI camera board. How is the sensor get the reference clock input? Is it derived from UB953 serializer?

    Rgds,
    Brijesh
  • Hi,

    At serializer side it's selected synchronous clock mode, so clock is passed from the deserializer to the serializer and sensor should use it as a reference clock.
    Also, please note after I change register 0x1F (CSI_PLL_CTL) at deserializer to 0x01 there is much less noise. This will change CSI transmitter frequency from 1.6 Gbps to 800 Mbps.

    Regards,
    Stefan.

  • Hi,

    Can cable length affect video quality?

    Regards,
    Stefan.
  • Hi Stefan,

    one question, are you running capture+ISP+display usecase? Can you please print statistics and share it?
    Lets first check if capture fps is really varying or the issue is somewhere else?

    Rgds,
    Brijesh
  • Hi,

    Yes, I'm running ISS Capture -> ISP -> Display usecase. Capture fps is varying, and max fps is 26, if there are not to much glitches on video. There are no frame drops on any link. I attached  statistics.

    Frame sync is disabled in ub960 configuration. Can this cause problem?

    Regards,

    Stefan.

    2148.stats.txt
    [IPU1-0]     84.857561 s:
    [IPU1-0]     84.857622 s:  CPU [IPU1-0 ] Statistics,
    [IPU1-0]     84.857683 s:  *************************
    [IPU1-0]     84.857744 s:
    [IPU1-0]     84.857805 s:  LOAD: CPU: 7.0% HWI: 1.2%, SWI:0.5%, Low Power: 89.8%
    [IPU1-0]     84.857927 s:
    [IPU1-0]     84.858049 s:  LOAD: TSK: DISPLAY0            : 0.3%
    [IPU1-0]     84.858140 s:  LOAD: TSK: ISSCAPTURE          : 0.1%
    [IPU1-0]     84.858232 s:  LOAD: TSK: ISSM2MISP           : 1.2%
    [IPU1-0]     84.858384 s:  LOAD: TSK: STAT_COLL           : 2.7%
    [IPU1-0]     84.858476 s:  LOAD: TSK: MISC                : 1.0%
    [IPU1-0]     84.858567 s:
    [IPU1-0]     84.858628 s:  SYSTEM: SW Message Box Msg Pool, Free Msg Count = 1023
    [IPU1-0]     84.858689 s:
    [IPU1-0]     84.858750 s:  SYSTEM: Sempahores Objects,   35 of 1024 free
    [IPU1-0]     84.858842 s:  SYSTEM: Task Objects      ,    7 of  100 free
    [IPU1-0]     84.858903 s:  SYSTEM: Clock Objects     ,   97 of  100 free
    [IPU1-0]     84.858994 s:  SYSTEM: Hwi Objects       ,   87 of  100 free
    [IPU1-0]     84.859086 s:
    [IPU1-0]     84.859147 s:  SYSTEM: Heap = LOCAL_DDR            @ 0x00000000, Total size = 262144 B (256 KB), Free size = 254072 B (248 KB)
    [IPU1-0]     84.859299 s:  SYSTEM: Heap = SR_OCMC              @ 0x00000000, Total size = 0 B (0 KB), Free size = 0 B (0 KB)
    [IPU1-0]     84.859452 s:  SYSTEM: Heap = SR_DDR_CACHED        @ 0x88103000, Total size = 368037888 B (350 MB), Free size = 305829888 B (291 MB)
    [IPU1-0]     84.859635 s:  SYSTEM: Heap = SR_DDR_NON_CACHED    @ 0xbfc00000, Total size = 129664 B (0 MB), Free size = 128896 B (0 MB)
    [IPU1-0]     84.859787 s:
    [IPU1-0]     84.859818 s:
    [IPU1-0]     84.859879 s:  CPU [HOST   ] Statistics,
    [IPU1-0]     84.859940 s:  *************************
    [IPU1-0]     84.860001 s:
    [IPU1-0]     84.860031 s:  LOAD: CPU: 0.3% HWI: 0.1%, SWI:0.1%, Low Power: 97.9%
    [IPU1-0]     84.860184 s:
    [IPU1-0]     84.860275 s:  LOAD: TSK: MISC                : 0.1%
    [IPU1-0]     84.860367 s:
    [IPU1-0]     84.860397 s:  SYSTEM: SW Message Box Msg Pool, Free Msg Count = 1023
    [IPU1-0]     84.860489 s:
    [IPU1-0]     84.860550 s:  SYSTEM: Sempahores Objects,  416 of 1024 free
    [IPU1-0]     84.860641 s:  SYSTEM: Task Objects      ,   38 of  100 free
    [IPU1-0]     84.860702 s:  SYSTEM: Clock Objects     ,   99 of  100 free
    [IPU1-0]     84.860794 s:  SYSTEM: Hwi Objects       ,   99 of  100 free
    [IPU1-0]     84.860885 s:
    [IPU1-0]     84.861221 s:  SYSTEM: Heap = LOCAL_DDR            @ 0x00000000, Total size = 6291456 B (6144 KB), Free size = 6255384 B (6108 KB)
    [IPU1-0]     84.861404 s:
    [IPU1-0]     84.861892 s:
    [IPU1-0]     84.861953 s:  UTILS_PRCM_STATS:  Current Temperature,
    [IPU1-0]     84.862014 s:
    [IPU1-0]     84.862044 s:   Voltage Rail         ||   Curr Temp Min - Max
    [IPU1-0]     84.862136 s:  ---------------------------------------------------------
    [IPU1-0]     84.862227 s:      PMHAL_PRCM_VD_MPU ||     [66.  0 , 66.400]
    [IPU1-0]     84.862349 s:     PMHAL_PRCM_VD_CORE ||     [67.200 , 67.600]
    [IPU1-0]     84.862441 s:    PMHAL_PRCM_VD_IVAHD ||     [67.200 , 67.600]
    [IPU1-0]     84.862563 s:   PMHAL_PRCM_VD_DSPEVE ||     [64.400 , 64.800]
    [IPU1-0]     84.862685 s:      PMHAL_PRCM_VD_GPU ||     [66.800 , 67.200]
    [IPU1-0]     84.862776 s:
    [IPU1-0]     84.862807 s: ============================================================================
    [IPU1-0]     84.862929 s: Name      | Bus (mV)  | Res (mOhm) | Shunt (uV)  | Current (mA) | Power (mW)
    [IPU1-0]     84.863020 s: ----------------------------------------------------------------------------
    [IPU1-0]     84.864423 s:  UTILS_PRCM_STATS: Reading the regulator data failed
    [IPU1-0]     84.864515 s:  UTILS_PRCM_STATS: PM INA226 Power Read Failed !!
    [IPU1-0]     84.864698 s:
    [IPU1-0]     84.864759 s:  Statistics Collector,
    [IPU1-0]     84.864820 s:
    [IPU1-0]     84.864850 s:        STATISTIC          Avg Data        Peak Data
    [IPU1-0]     84.864911 s:        COLLECTOR          MB/s            MB/s
    [IPU1-0]     84.865003 s:  --------------------------------------------------
    [IPU1-0]     84.865094 s:  SCI_EMIF1 RD+WR      |    481.570820   1405.915875
    [IPU1-0]     84.865186 s:  SCI_EMIF2 RD+WR      |      0.000000      0.000000
    [IPU1-0]     84.865277 s:  SCI_EMIF1 RD ONLY    |    295.754288    838.784260
    [IPU1-0]     84.865399 s:  SCI_EMIF1 WR ONLY    |    185.960060    567.594753
    [IPU1-0]     84.865521 s:  SCI_EMIF2 RD ONLY    |      0.000000      0.000000
    [IPU1-0]     84.865613 s:  SCI_EMIF2 WR ONLY    |      0.000000      0.000000
    [IPU1-0]     84.865735 s:  SCI_MA_MPU_P1        |      0.003334      2.187924
    [IPU1-0]     84.865826 s:  SCI_MA_MPU_P2        |      0.000000      0.000000
    [IPU1-0]     84.865948 s:  SCI_DSS              |    186.536699    195.561691
    [IPU1-0]     84.866040 s:  SCI_IPU1             |      5.141251     20.171931
    [IPU1-0]     84.866131 s:  SCI_VIP1_P1          |      0.000000      0.000000
    [IPU1-0]     84.866253 s:  SCI_VIP1_P2          |      0.000000      0.000000
    [IPU1-0]     84.866345 s:  SCI_VPE_P1           |      0.000000      0.000000
    [IPU1-0]     84.866436 s:  SCI_VPE_P2           |      0.000000      0.000000
    [IPU1-0]     84.866711 s:  SCI_DSP1_MDMA        |      0.000000      0.000000
    [IPU1-0]     84.866833 s:  SCI_DSP1_EDMA        |      0.000000      0.000000
    [IPU1-0]     84.866924 s:  SCI_DSP2_MDMA        |      0.000000      0.000000
    [IPU1-0]     84.867016 s:  SCI_DSP2_EDMA        |      0.000000      0.000000
    [IPU1-0]     84.867107 s:  SCI_EVE1_TC0         |      0.000000      0.000000
    [IPU1-0]     84.867199 s:  SCI_EVE1_TC1         |      0.000000      0.000000
    [IPU1-0]     84.867321 s:  SCI_EVE2_TC0         |      0.000000      0.000000
    [IPU1-0]     84.867412 s:  SCI_EVE2_TC1         |      0.000000      0.000000
    [IPU1-0]     84.867534 s:  SCI_EDMA_TC0_RD      |      0.000000      0.000000
    [IPU1-0]     84.867626 s:  SCI_EDMA_TC0_WR      |      0.000000      0.000000
    [IPU1-0]     84.867717 s:  SCI_EDMA_TC1_RD      |      0.000000      0.000000
    [IPU1-0]     84.867839 s:  SCI_EDMA_TC1_WR      |      0.000000      0.000000
    [IPU1-0]     84.867931 s:  SCI_VIP2_P1          |      0.000000      0.000000
    [IPU1-0]     84.868022 s:  SCI_VIP2_P2          |      0.000000      0.000000
    [IPU1-0]     84.868114 s:  SCI_IVA              |      0.000000      0.000000
    [IPU1-0]     84.868236 s:  SCI_GPU_P1           |      0.000000      0.000000
    [IPU1-0]     84.868388 s:  SCI_GPU_P2           |      0.000000      0.000000
    [IPU1-0]     84.868480 s:  SCI_GMAC_SW          |      0.000000      0.000000
    [IPU1-0]     84.868602 s:  SCI_OCMC_RAM1        |      0.000000      0.000000
    [IPU1-0]     84.868693 s:  SCI_OCMC_RAM2        |      0.000000      0.000000
    [IPU1-0]     84.868815 s:  SCI_OCMC_RAM3        |      0.000000      0.000000
    [IPU1-0]     84.868907 s:  SCI_ISS_RT           |      0.000000      0.000000
    [IPU1-0]     84.868998 s:  SCI_ISS_NRT1         |    184.795143   1049.387573
    [IPU1-0]     84.869120 s:  SCI_ISS_NRT2         |      0.000000      0.000000
    [IPU1-0]     84.869212 s:  SCI_CAL              |    106.201501    128.521031
    [IPU1-0]     84.968767 s:
    [IPU1-0]     84.968828 s:
    [IPU1-0]     84.968950 s:
    [IPU1-0]     84.968980 s:  ### CPU [IPU1-0], LinkID [ 81],
    [IPU1-0]     84.969072 s:
    [IPU1-0]     84.969102 s:  [ ISSCAPTURE ] Link Statistics,
    [IPU1-0]     84.969163 s:  ******************************
    [IPU1-0]     84.969224 s:
    [IPU1-0]     84.969285 s:  Elapsed time       = 10188 msec
    [IPU1-0]     84.969346 s:
    [IPU1-0]     84.969377 s:  Get Full Buf Cb    =  25.42 fps
    [IPU1-0]     84.969468 s:  Put Empty Buf Cb   =  25.32 fps
    [IPU1-0]     84.969560 s:  Driver/Notify Cb   =  25.52 fps
    [IPU1-0]     84.969651 s:
    [IPU1-0]     84.969682 s:  Input Statistics,
    [IPU1-0]     84.969895 s:
    [IPU1-0]     84.969926 s:  CH | In Recv | In Drop | In User Drop | In Process
    [IPU1-0]     84.970017 s:     | FPS     | FPS     | FPS          | FPS
    [IPU1-0]     84.970078 s:  --------------------------------------------------
    [IPU1-0]     84.970170 s:   0 |  25.32      0. 0      0. 0          25.32
    [IPU1-0]     84.970322 s:
    [IPU1-0]     84.970353 s:  Output Statistics,
    [IPU1-0]     84.970414 s:
    [IPU1-0]     84.970444 s:  CH | Out | Out     | Out Drop | Out User Drop
    [IPU1-0]     84.970536 s:     | ID  | FPS     | FPS      | FPS
    [IPU1-0]     84.970627 s:  ---------------------------------------------
    [IPU1-0]     84.970688 s:   0 |  0     25.42     0. 0      0. 0
    [IPU1-0]     84.970810 s:
    [IPU1-0]     84.970841 s:  [ ISSCAPTURE ] LATENCY,
    [IPU1-0]     84.970902 s:  ********************
    [IPU1-0]     84.970963 s:
    [IPU1-0]     84.971085 s:
    [IPU1-0]     84.971115 s:  ### CPU [IPU1-0], LinkID [ 82],
    [IPU1-0]     84.971176 s:
    [IPU1-0]     84.971237 s:  [ ISSM2MISP ] Link Statistics,
    [IPU1-0]     84.971298 s:  ******************************
    [IPU1-0]     84.971359 s:
    [IPU1-0]     84.971390 s:  Elapsed time       = 10190 msec
    [IPU1-0]     84.971481 s:
    [IPU1-0]     84.971725 s:  New data Recv      =  25.41 fps
    [IPU1-0]     84.971786 s:  Get Full Buf Cb    =  25.31 fps
    [IPU1-0]     84.971878 s:  Driver/Notify Cb   =  25.31 fps
    [IPU1-0]     84.971939 s:
    [IPU1-0]     84.972000 s:  Input Statistics,
    [IPU1-0]     84.972030 s:
    [IPU1-0]     84.972091 s:  CH | In Recv | In Drop | In User Drop | In Process
    [IPU1-0]     84.972152 s:     | FPS     | FPS     | FPS          | FPS
    [IPU1-0]     84.972244 s:  --------------------------------------------------
    [IPU1-0]     84.972305 s:   0 |  25.41      0. 0      0. 0          25.31
    [IPU1-0]     84.972457 s:
    [IPU1-0]     84.972488 s:  Output Statistics,
    [IPU1-0]     84.972549 s:
    [IPU1-0]     84.972610 s:  CH | Out | Out     | Out Drop | Out User Drop
    [IPU1-0]     84.972671 s:     | ID  | FPS     | FPS      | FPS
    [IPU1-0]     84.972762 s:  ---------------------------------------------
    [IPU1-0]     84.972884 s:   0 |  0     25.31     0. 0      0. 0
    [IPU1-0]     84.973006 s:
    [IPU1-0]     84.973037 s:  [ ISSM2MISP ] LATENCY,
    [IPU1-0]     84.973098 s:  ********************
    [IPU1-0]     84.973159 s:  Local Link Latency     : Avg =   7539 us, Min =   7503 us, Max =   7686 us,
    [IPU1-0]     84.973281 s:  Source to Link Latency : Avg =   7612 us, Min =   7564 us, Max =   7778 us,
    [IPU1-0]     84.973403 s:
    [IPU1-0]     84.973525 s:
    [IPU1-0]     84.973555 s:  ### CPU [IPU1-0], LinkID [ 71],
    [IPU1-0]     84.973647 s:
    [IPU1-0]     84.973677 s:  [ DISPLAY ] Link Statistics,
    [IPU1-0]     84.973738 s:  ******************************
    [IPU1-0]     84.973799 s:
    [IPU1-0]     84.973830 s:  Elapsed time       = 10184 msec
    [IPU1-0]     84.973921 s:
    [IPU1-0]     84.973952 s:  New data Recv      =  25.33 fps
    [IPU1-0]     84.974013 s:  Driver/Notify Cb   =  60.9 fps
    [IPU1-0]     84.974104 s:
    [IPU1-0]     84.974135 s:  Input Statistics,
    [IPU1-0]     84.974196 s:
    [IPU1-0]     84.974226 s:  CH | In Recv | In Drop | In User Drop | In Process
    [IPU1-0]     84.974318 s:     | FPS     | FPS     | FPS          | FPS
    [IPU1-0]     84.974379 s:  --------------------------------------------------
    [IPU1-0]     84.974470 s:   0 |  25.33      0. 0      0. 0          25.33
    [IPU1-0]     84.974623 s:
    [IPU1-0]     84.974653 s:  Output Statistics,
    [IPU1-0]     84.974714 s:
    [IPU1-0]     84.974745 s:  CH | Out | Out     | Out Drop | Out User Drop
    [IPU1-0]     84.974806 s:     | ID  | FPS     | FPS      | FPS
    [IPU1-0]     84.974897 s:  ---------------------------------------------
    [IPU1-0]     84.974958 s:
    [IPU1-0]     84.974989 s:  [ DISPLAY ] LATENCY,
    [IPU1-0]     84.975050 s:  ********************
    [IPU1-0]     84.975111 s:  Local Link Latency     : Avg =     37 us, Min =     30 us, Max =    122 us,
    [IPU1-0]     84.975233 s:  Source to Link Latency : Avg =   7769 us, Min =   7716 us, Max =   7900 us,
    [IPU1-0]     84.975355 s:
    [IPU1-0]     84.975385 s:  Display UnderFlow Count = 0
    [IPU1-0]     84.975446 s:
    [IPU1-0]     85.474562 s:
    [IPU1-0]
    [IPU1-0]  ====================
    [IPU1-0]  Chains Run-time Menu
    [IPU1-0]  ====================
    [IPU1-0]
    [IPU1-0]  0: Stop Chain
    [IPU1-0]
    [IPU1-0]  1: Save ISS Frame
    [IPU1-0]
    [IPU1-0]  2: Save ISP Frame
    [IPU1-0]
    [IPU1-0]  p: Print Performance Statistics
    [IPU1-0]
    [IPU1-0]  Enter Choice:
    [IPU1-0]


  • Hi Stefan,

    Can you try setting 0x1F to 0x5 in UB960 registers?
    Also can you try changing the number of lanes to two between imx390 and ub953?

    Rgds,
    Brijesh
  • Hi Brijesh,

    If I set register 0x1F to 0x05 in UB960 all I2C writes to serializer fail. Also, I'm able to change number of lanes on UB953, but I don't know which register should I change on IMX390 to change number of lanes. I don't have datasheet for IMX390. Can you provide me datasheet or value and address which I should change.

    Regards,

    Stefan.

  • Hi Brijesh,

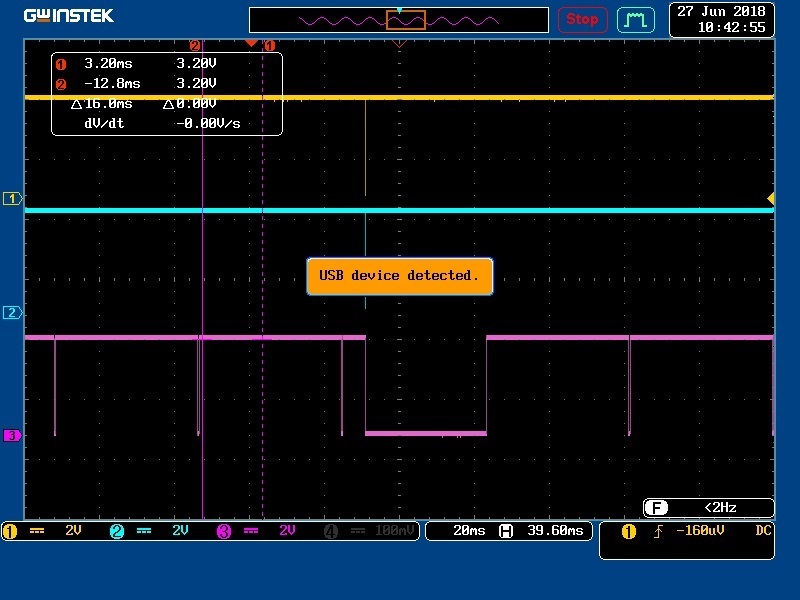
    Few updates: I checked PASS/LOCK/FrameStart signals when using IMX390 sensor and it seems they are unstable. Please check video provided on link: https://dl.rt-rk.com/?t=59e38f7423f6fad5c931258b81ba3b76

    Yellow signal = PASS

    Blue signal = LOCK

    Violet signal = Frame start

    Mostly, this flickering happens in same time when PASS/LOCK change state to 0. This also affects on frame start signal.

    I attached image with those signals, It can be seen more clearly.

    Also, If I start serializer UB953 in pattern mode (1280x720, 30 fps) I'm receiving correct video (no flickering) but frame rate is ~14 fps. In datasheet for UB953 there is provided code for 30 fps and I'm using same.

    You can check video: https://dl.rt-rk.com/?t=c0169a2759d2e3ea6d3e7c94def9f14f

    Now I have few questions for you:

    1. Do you have idea what can destabilize this signals? Do you think it's HW or SW problem?

    2. Is purpose of FrameSync signal to trigger sending of frames?  If frame is sent from sensor on every rising edge of FrameSync signal, it means It's possible to control frame rate with some external signal (GPIO)?

    3. Is it enough to provide FrameSync signal on specific GPIO on serializer or It's necessary also to enable FrameSync mode on sensor side? I enabled FrameSync for SENSOR_SONY_IMX390_UB953_D3 in file iss_sensor_tda2px.c and I can see that signal on oscilloscope. Also I can change FS_HIGH and FS_LOW times and that change is visible on oscilloscope, but there is no expected change on frame rate.

    4. Why I can not achieve 30 fps in serializer test pattern mode? (I can get ~30 fps in deserializer pattern mode).

    Best regards,

    Stefan.

  • Hi Brijesh,

    I think problem is path between UB953 and UB960. I noticed following:

    - Serializer in test pattern mode 1280x720 -> I'm receiving ~15 fps.
    - Serializer in test pattern mode 1920x1080 -> I'm receiving <4 fps (MAX ~8 fps).

    Also, In FULL HD test mode, PASS/LOCK/FrameStart signals are not stable, as I descibed you in previous message. But, If I change register 0x1F (CSI_PLL_CTL) at deserializer to 0x01 signals are pretty stable. In that case I'm receiving MAX frame rate (~8 fps).

    It seems there are some problems with throughput. Can PoC produce this kind of problems?

    Regards,
    Stefan.
  • Hi,

    I managed to get 30 fps in FULL HD test pattern mode by changing PGEN_LINE_PD (Line period) register. But, with one value I'm getting ~30 fps on deserializer, but with same value I'm getting about 15 fps on serializer - It should be same framerate?! But, If I reduce that value I can get 30 fps also on serializer.

    But, still there is a problem with CSI transmitter speed - If I select 1.6 Gbps signals become unstable, but If I select 800 Mbps everything looks fine in pattern mode. Also, please note If I select 1.6 Gbps signals are worse if cable is longer.

    With real sensor I can't get completely stable image. I attached image with Frame Start signal. Signal low time is ~330 microseconds. Could that be too short time? It's time between two consecutive frames.

    Regards,

    Stefan.

  • Hi Stefan,

    Are you still facing this problem? If not, can we close this thread?

    Regards,
    Brijesh
  • Hi Brijesh,

    The problem was solved when I reduced CSI-2 transmitter speed to 1.2 Gbps per lane. Also, before that I had to disable all unused ports at UB960. So, we can close this thread, but I would like to know why I had problems with 1.6 Gbps,

    Regards,
    Stefan.